Using Straight Line Graphs to Locate Regions Defined by Inequalities
⭐ Higher Tier Content
Straight line graphs can be used to represent inequalities and to identify regions of the coordinate plane that satisfy given conditions. This is commonly used when working with constraints in algebra and real life problems.
Inequalities on a Graph
An inequality compares two expressions using symbols such as
\( < \), \( > \), \( \le \) or \( \ge \).
For example:
$$
y > 2x + 1
$$
This inequality represents all points where the y coordinate is greater than \( 2x + 1 \).
Drawing the Boundary Line
To represent an inequality on a graph, first draw the boundary line by replacing the inequality symbol with an equals sign.
For example, for:
$$
y > 2x + 1
$$
draw the line:
$$
y = 2x + 1
$$
This line separates the plane into two regions.
• Use a dashed line if the inequality is \( < \) or \( > \)
• Use a solid line if the inequality is \( \le \) or \( \ge \)
The dashed line shows the boundary is not included.
The solid line shows the boundary is included.
Deciding Which Region to Shade
After drawing the boundary line, decide which side of the line satisfies the inequality.
Choose a test point, usually:
$$
(0,\ 0)
$$
Substitute it into the inequality.
For example, using:
$$
y > 2x + 1
$$
Substitute \( (0,\ 0) \):
$$
0 > 1
$$
This is false, so the region containing \( (0,\ 0) \) is not shaded.
Shade the region on the opposite side of the line.
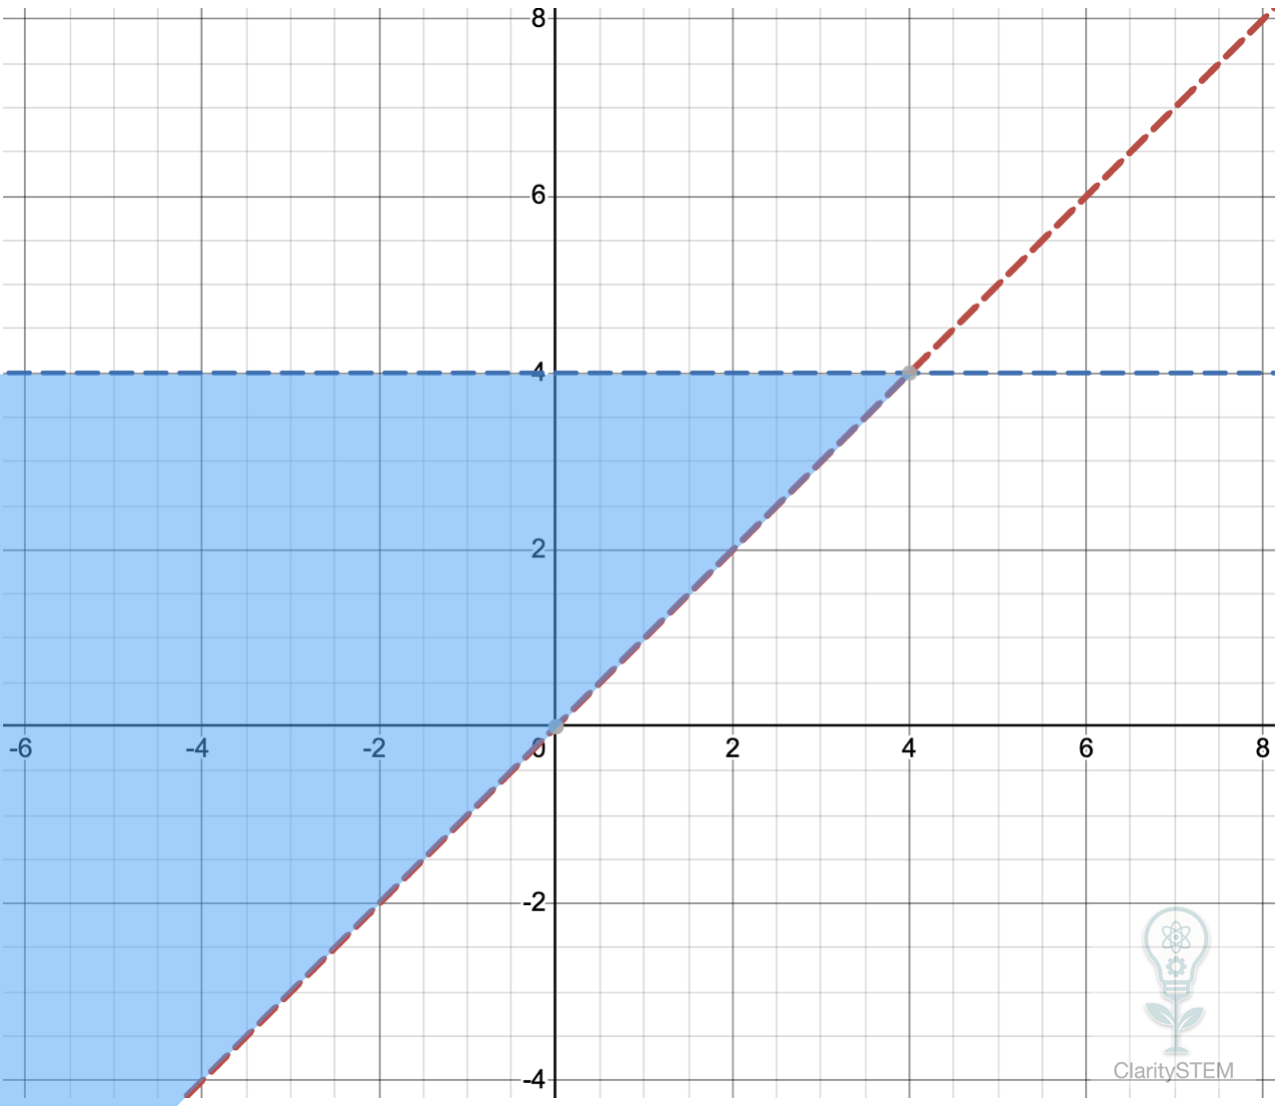
Another Example
Consider:
$$
y \le -x + 4
$$
Draw the boundary line:
$$
y = -x + 4
$$
Use a solid line because of the \( \le \) symbol.
Test \( (0,\ 0) \):
$$
0 \le 4
$$
This is true, so the region containing the origin is shaded.
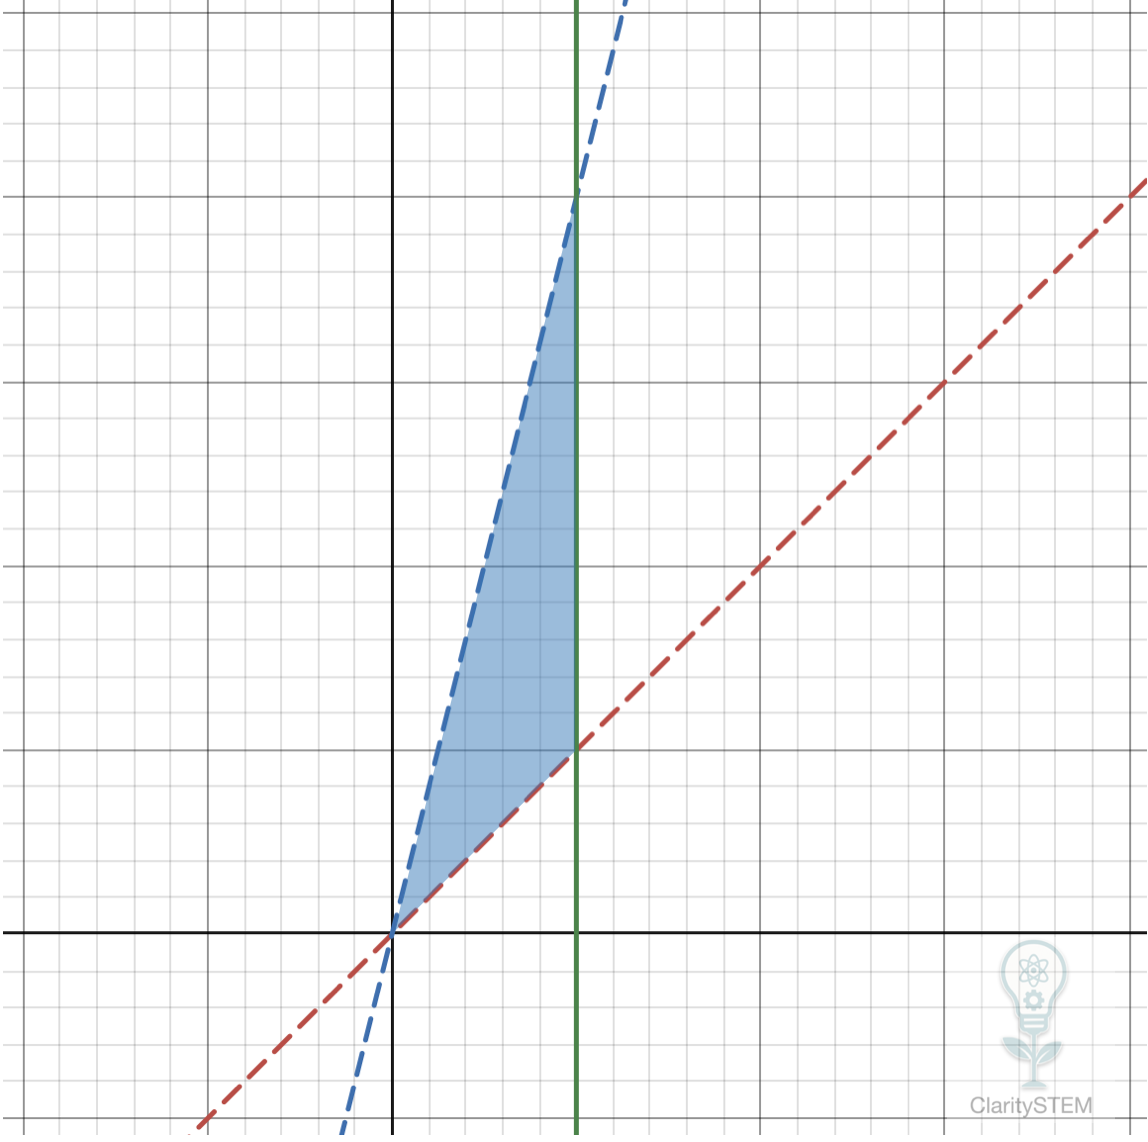
Regions Defined by Two Inequalities
Sometimes a region is defined by more than one inequality.
For example:
$$
y > x
$$
$$
y < 4
$$
Each inequality is graphed separately.
The solution is the region where the shaded areas overlap.
Interpreting the Shaded Region
Any point inside the shaded region satisfies the inequality or inequalities.
Any point outside the region does not.
Points on a solid boundary line are included in the solution.
Points on a dashed boundary line are not included.
Key Points to Remember
Always draw the boundary line first using an equation.
Use dashed lines for \( < \) and \( > \), solid lines for \( \le \) and \( \ge \).
Use a test point to decide which side to shade.
For multiple inequalities, the solution is the overlapping shaded region.
Using straight line graphs to locate regions defined by inequalities provides a clear visual way to understand constraints and solutions in algebra.