Constructing and Using Tangents to Estimate Rates of Change
⭐ Higher Tier Content
This topic focuses on using tangents to curves to estimate rates of change for non linear functions. These ideas are applied to real life situations using compound measures, such as velocity and acceleration.
Rates of Change on Curved Graphs
For a straight line graph, the rate of change is constant and equal to the gradient.
For a curve, the rate of change is not constant. Instead, it changes from point to point.
To estimate the rate of change at a particular point on a curve, a tangent is used.
A tangent is a straight line that just touches the curve at one point and has the same direction as the curve at that point.
Constructing a Tangent
To construct a tangent at a point on a curve:
• Place a ruler so it touches the curve at the chosen point
• Adjust the ruler until it follows the direction of the curve at that point
• Draw the straight line
The tangent should touch the curve at only one point and not cut across it.
Estimating the Rate of Change
Once the tangent is drawn, the rate of change is estimated by finding the gradient of the tangent.
Choose two well spaced points on the tangent and read their coordinates.
Then calculate the gradient using:
\( gradient = \frac{change\ in\ y}{change\ in\ x} \)
This gradient is an estimate of the rate of change of the curve at that point.
The more accurately the tangent is drawn, the better the estimate
Distance Time Graphs and Velocity
On a distance time graph:
• distance is on the vertical axis
• time is on the horizontal axis
The gradient represents velocity.
For a curved distance time graph, the velocity is changing.
To find the velocity at a specific time:
• draw a tangent to the curve at that time
• calculate the gradient of the tangent
The velocity is expressed using a compound measure, such as metres per second or kilometres per hour.
Example
$$
velocity = \frac{distance}{time}
$$
A steeper tangent means a greater velocity.
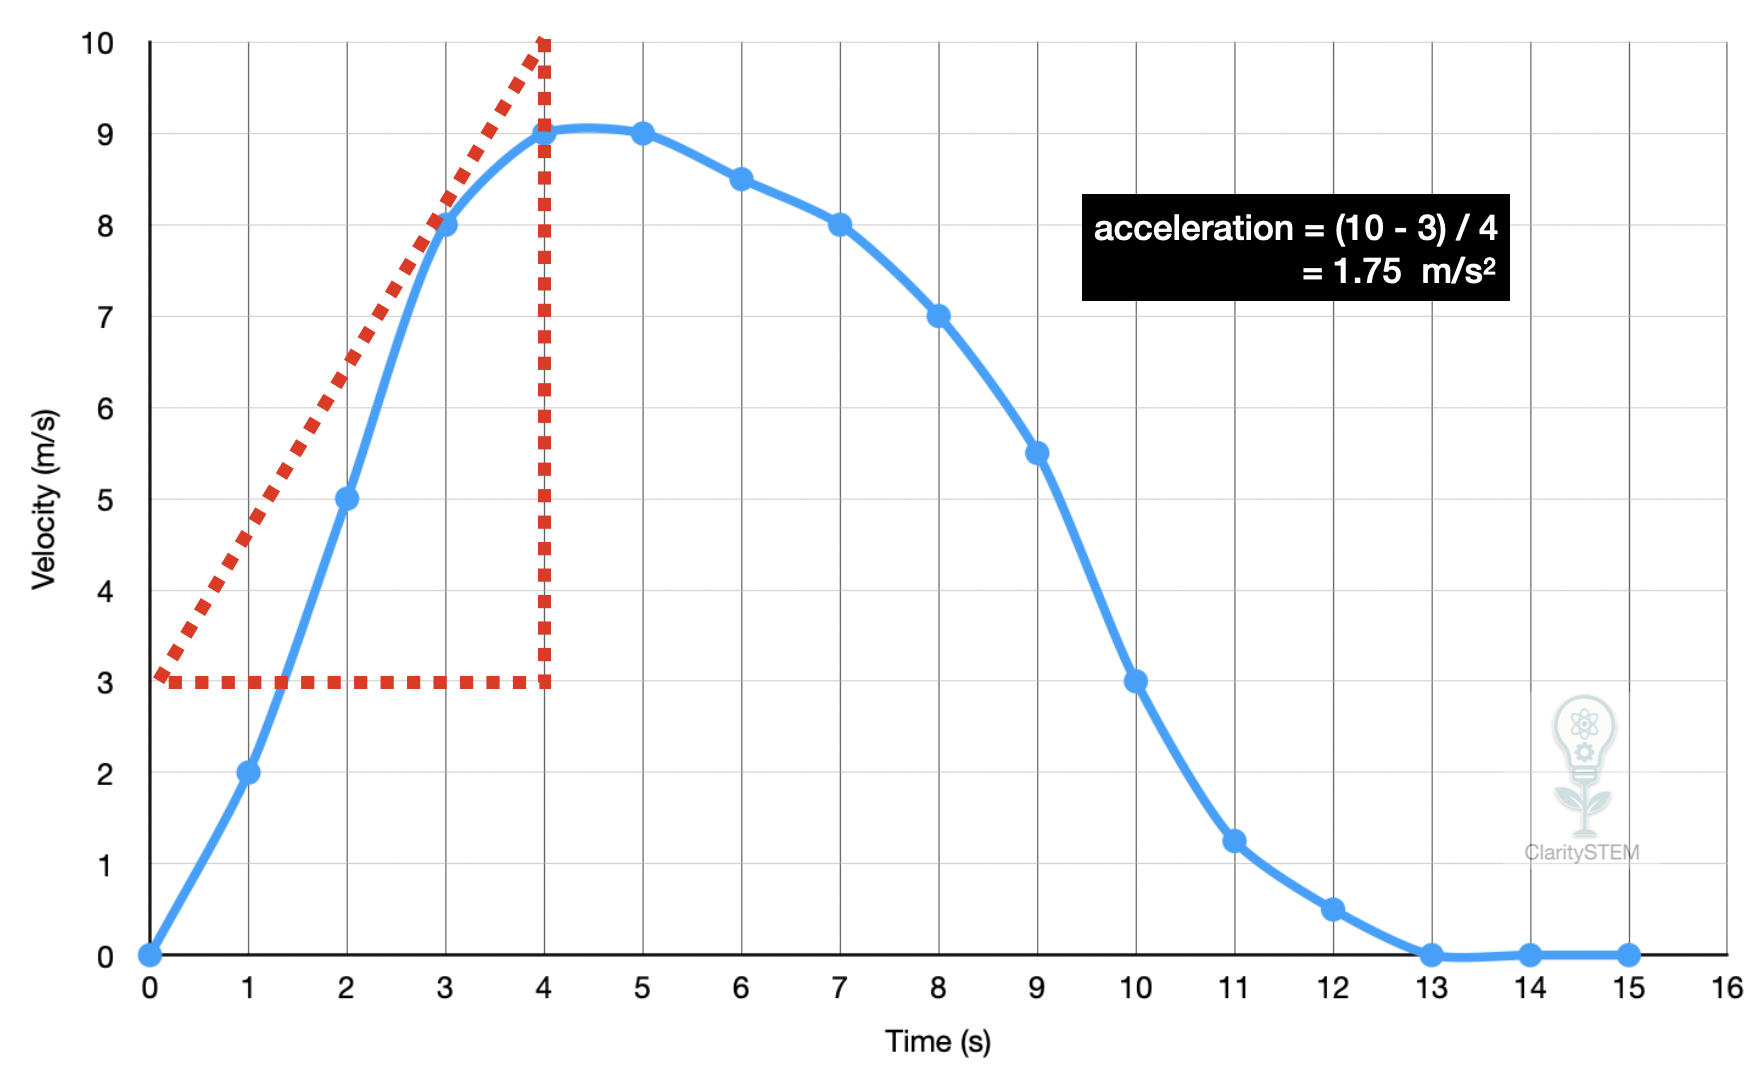
Velocity Time Graphs and Acceleration
On a velocity time graph:
• velocity is on the vertical axis
• time is on the horizontal axis
The gradient represents acceleration.
If the graph is curved, the acceleration is changing.
To estimate the acceleration at a specific time:
• draw a tangent to the curve
• calculate the gradient of the tangent
The acceleration is expressed using a compound measure, such as metres per second squared.
Example
$$
acceleration = \frac{change\ in\ velocity}{time}
$$
A horizontal tangent represents zero acceleration
Using Appropriate Units
When expressing rates of change, it is important to use correct units.
Examples include:
• metres per second for velocity
• kilometres per hour for velocity
• metres per second squared for acceleration
Always check the axes of the graph to determine the correct units.
Key Points to Remember
Tangents are used to estimate rates of change on curves.
The gradient of a tangent gives the rate of change at a point.
On distance time graphs, the gradient represents velocity.
On velocity time graphs, the gradient represents acceleration.
Rates of change must be expressed using appropriate compound units.
Using tangents allows you to estimate changing rates in non linear situations and interpret motion accurately from graphical information.