Using Graphs to Solve Equations Involving Quadratics and Cubics
⭐ Higher Tier Content
This topic explains how to solve equations by graphical methods when a quadratic or cubic expression is equal to a linear expression. The solution is found by interpreting where graphs intersect.
Solving Equations of the Form ax² + bx + c = dx + e
To solve an equation of this form graphically, you compare a quadratic graph with a straight line graph.
The equation is
\( ax^2 + bx + c = dx + e \)
Step 1: Write both sides as separate equations
Draw the graph of the quadratic function
\( y = ax^2 + bx + c \)
Draw the graph of the linear function
\( y = dx + e \)
Step 2: Plot both graphs on the same set of axes
Choose a suitable scale and calculate enough points to sketch each graph accurately.
Step 3: Find the points of intersection
The solutions are the x coordinates where the two graphs cross.
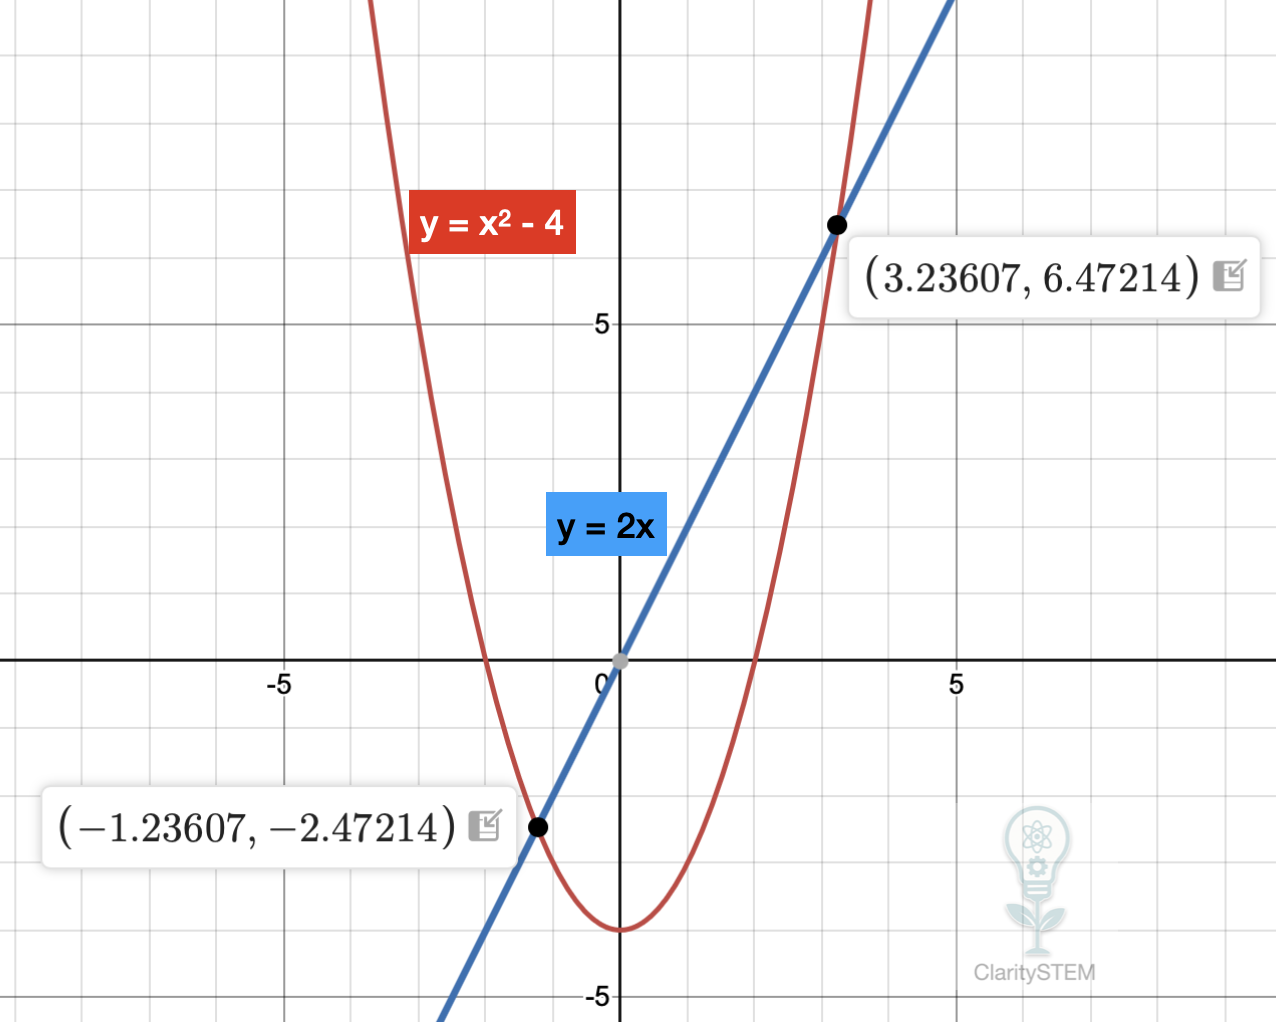
Example
$$
x^2 - 4 = 2x
$$
Rearrange into two functions:
$$
y = x^2 - 4
$$
$$
y = 2x
$$
From the graph, the curves intersect at:
$$
x \approx -1.2
$$
and
$$
x \approx 3.2
$$
These are the solutions to the equation.
Solving Equations of the Form ax³ + bx² + cx + d = ex + f
To solve this type of equation graphically, you compare a cubic graph with a straight line graph.
The equation is
\( ax^3 + bx^2 + cx + d = ex + f \)
Step 1: Write each side as a function
Cubic function:
\( y = ax^3 + bx^2 + cx + d \)
Linear function:
\( y = ex + f \)
Step 2: Draw both graphs on the same axes
Cubic graphs may change direction, so use several x values to capture the shape accurately.
Step 3: Read the solutions
The solutions are the x coordinates of the intersection points.
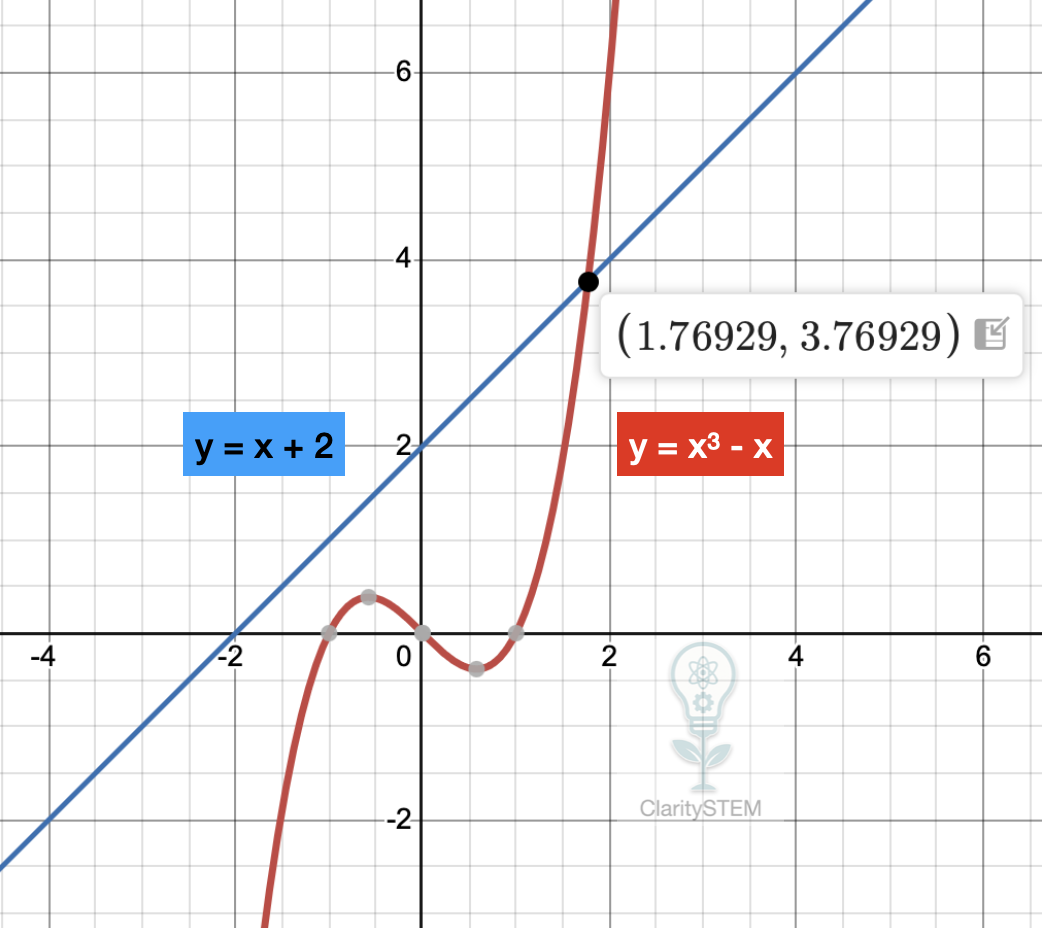
Example
$$
x^3 - x = x + 2
$$
Rearrange into two functions:
$$
y = x^3 - x
$$
$$
y = x + 2
$$
From the graph, the curves intersect at:
$$
x \approx 1.77
$$
These values solve the equation.
Interpreting Graphical Solutions
Each intersection point represents a value of \( x \) that makes both sides of the original equation equal.
Some equations may have:
• two solutions
• one solution
• or no real solutions
This depends on how the graphs meet.
Graphical solutions may be approximate, so always read values carefully from the graph.
Key Points to Remember
Graphical methods solve equations by finding intersections of graphs.
Set each side of the equation equal to \( y \) and draw both graphs.
Solutions are the x coordinates where the graphs cross.
Quadratic equations can have up to two solutions.
Cubic equations can have up to three solutions.
Using graphs provides a clear visual method for solving equations and understanding how different functions relate to each other.