Interpreting and Using Mathematical Information
Mathematical information is often presented in written or visual form rather than as calculations. This can include infographics, schedules, tables, timetables, calendars and charts. Being able to interpret this information correctly is an important mathematical skill.
The first step is to carefully read any headings, labels, units and keys. These explain what the information represents and how values should be interpreted. Misreading units or scales is a common source of error.
Information in tables and schedules is usually organised into rows and columns. Each row or column represents a different category or time period. You must select the correct values before carrying out any calculation.
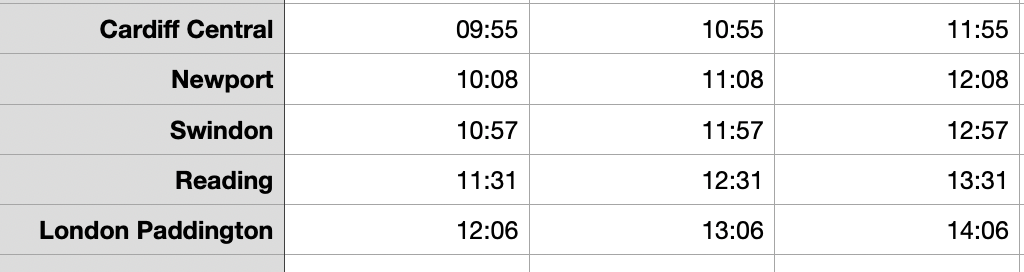
For example, if a timetable shows a train leaving at \( 09{:}55 \) and arriving at \( 12{:}06 \), the journey time is found by calculating the difference between these times.
$$
12{:}06 - 09{:}55 = 2{:}11
$$
So the journey lasts 2 hour and 11 minutes.
Charts and graphs show how values change or compare. The vertical axis usually shows the quantity being measured and the horizontal axis shows time or categories. The scale on each axis must be checked before reading values. Some scales increase in steps of \( 2 \), \( 5 \) or \( 10 \), not always \( 1 \).
Infographics often combine numbers with text and symbols. Relevant data may need to be extracted before it can be used in a calculation. Not all information shown will always be needed.
When interpreting any visual or written mathematical information, always identify what is being shown, what units are used and what the question is asking before performing calculations. This ensures conclusions and answers are accurate and sensible.