Drawing and Interpreting Quadratic Graphs and Solving Using y = k
Quadratic graphs are curves formed from equations of the form:
$$
y = ax^2 + bx + c
$$
These graphs are used to model curved relationships and can be combined with straight lines of the form \( y = k \) to solve equations.
The Shape of a Quadratic Graph
The graph of \( y = ax^2 + bx + c \) is a parabola.
• If \( a > 0 \), the graph opens upwards
• If \( a < 0 \), the graph opens downwards
The value of \( a \) controls how steep or narrow the curve is.
Key Features of y = ax² + bx + c
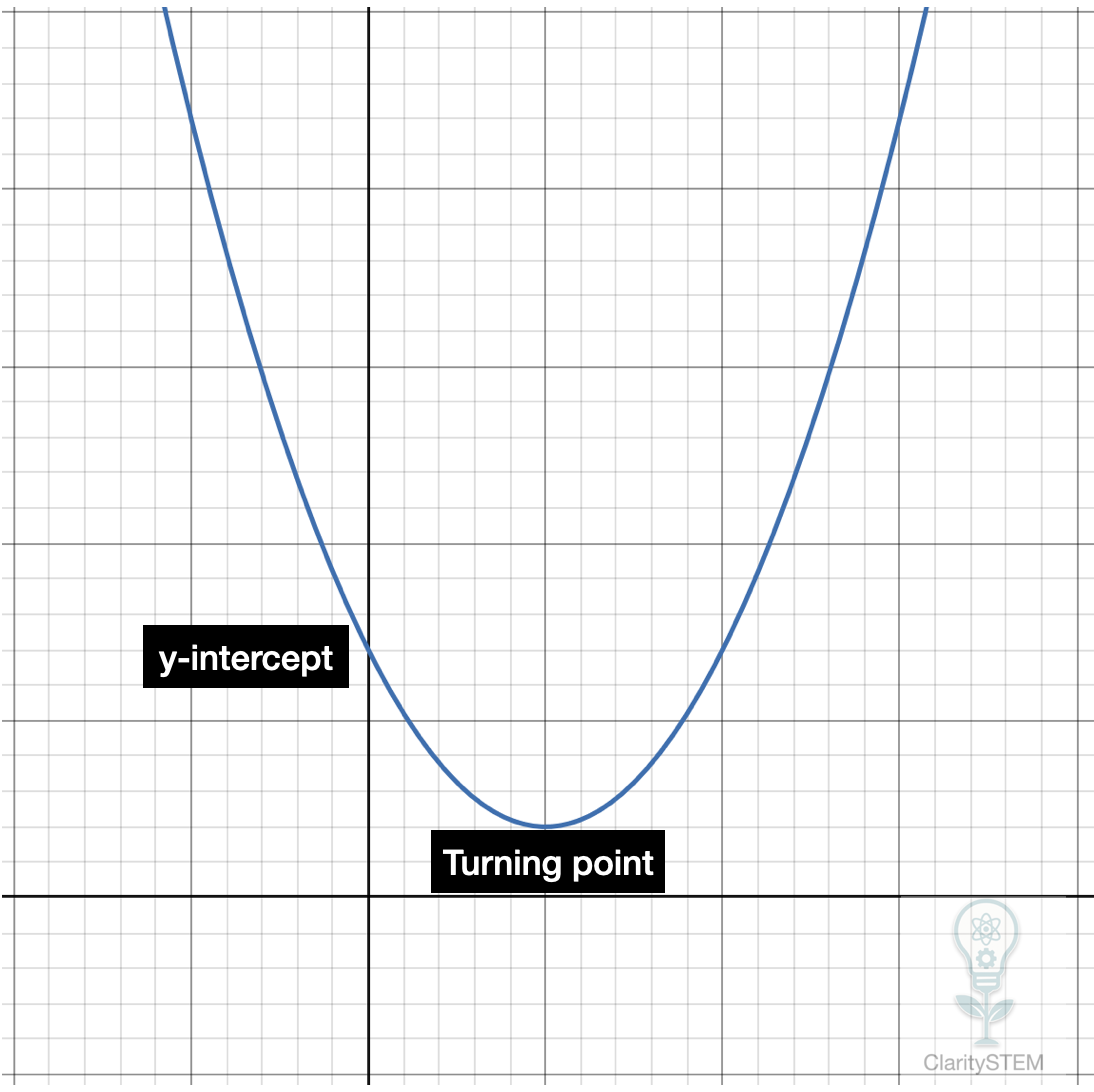
The graph has several important features.
The y-intercept occurs when \( x = 0 \):
$$
y = c
$$
So the curve crosses the y axis at:
$$
(0,\ c)
$$
The graph may also cross the x axis at one or two points. These are called the roots or solutions of the quadratic equation:
$$
ax^2 + bx + c = 0
$$
The turning point is the minimum or maximum point of the graph, depending on whether the curve opens upwards or downwards.
Sketching a Quadratic Graph
To sketch a quadratic graph:
- Identify whether the curve opens upwards or downwards from the value of \( a \)
- Plot the y-intercept \( (0,\ c) \)
- Plot additional points by choosing values of \( x \)
- Draw a smooth curve through the points
For example, for:
$$
y = x^2 - 4x + 3
$$
Useful points include:
$$
x = 0 \Rightarrow y = 3
$$
$$
x = 1 \Rightarrow y = 0
$$
$$
x = 2 \Rightarrow y = -1
$$
$$
x = 3 \Rightarrow y = 0
$$
Solving ax² + bx + c = k Using Graphs
To solve an equation of the form:
$$
ax^2 + bx + c = k
$$
this can be interpreted graphically.
Rewrite the equation as:
$$
y = ax^2 + bx + c
$$
and draw the horizontal line:
$$
y = k
$$
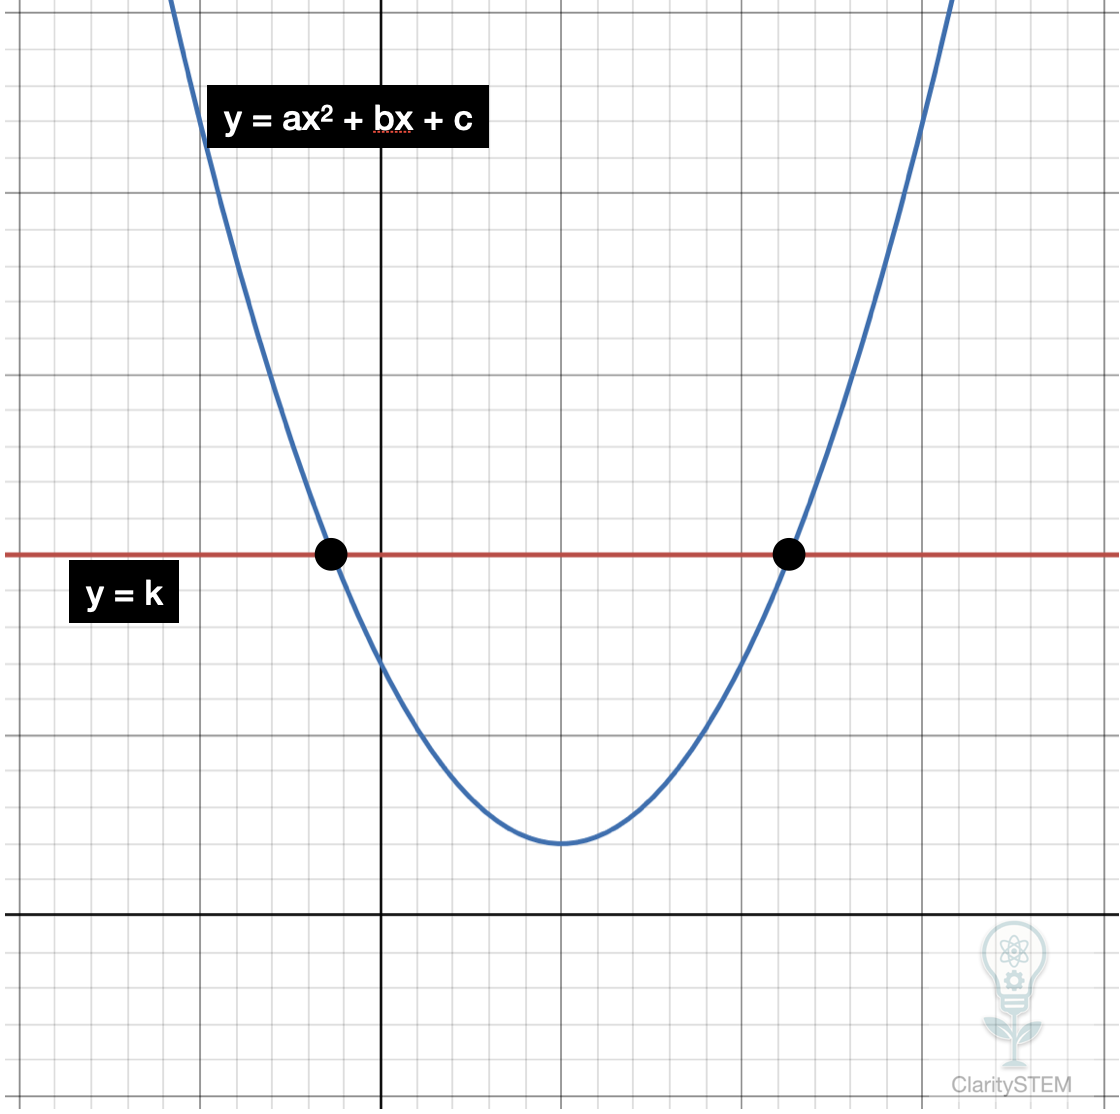
The solutions to the equation are the x-coordinates of the points where the curve and the line intersect.
Example of Solving Using y = k
Consider:
$$
y = x^2 - 4x + 3
$$
and the line:
$$
y = 1
$$
The points of intersection satisfy:
$$
x^2 - 4x + 3 = 1
$$
Graphically, these are the points where the horizontal line \( y = 1 \) crosses the curve.
From the graph, the solutions are:
$$
x = 1 \text{ and } x = 3
$$
Interpreting the Number of Solutions
• If the line \( y = k \) cuts the curve in two places, there are two solutions
• If it touches the curve once, there is one solution
• If it does not meet the curve, there are no real solutions
This links directly to solving quadratic equations algebraically.
Key Points to Remember
Quadratic graphs are curves called parabolas.
The sign of \( a \) determines whether the curve opens up or down.
The y-intercept is \( (0,\ c) \).
Solving \( ax^2 + bx + c = k \) means finding where the curve meets the line \( y = k \).
Solutions are read from the x-coordinates of intersection points.
Drawing and interpreting quadratic graphs provides a powerful visual method for understanding and solving quadratic equations.