Drawing and Interpreting Non Linear Graphs
⭐ Higher Tier Content
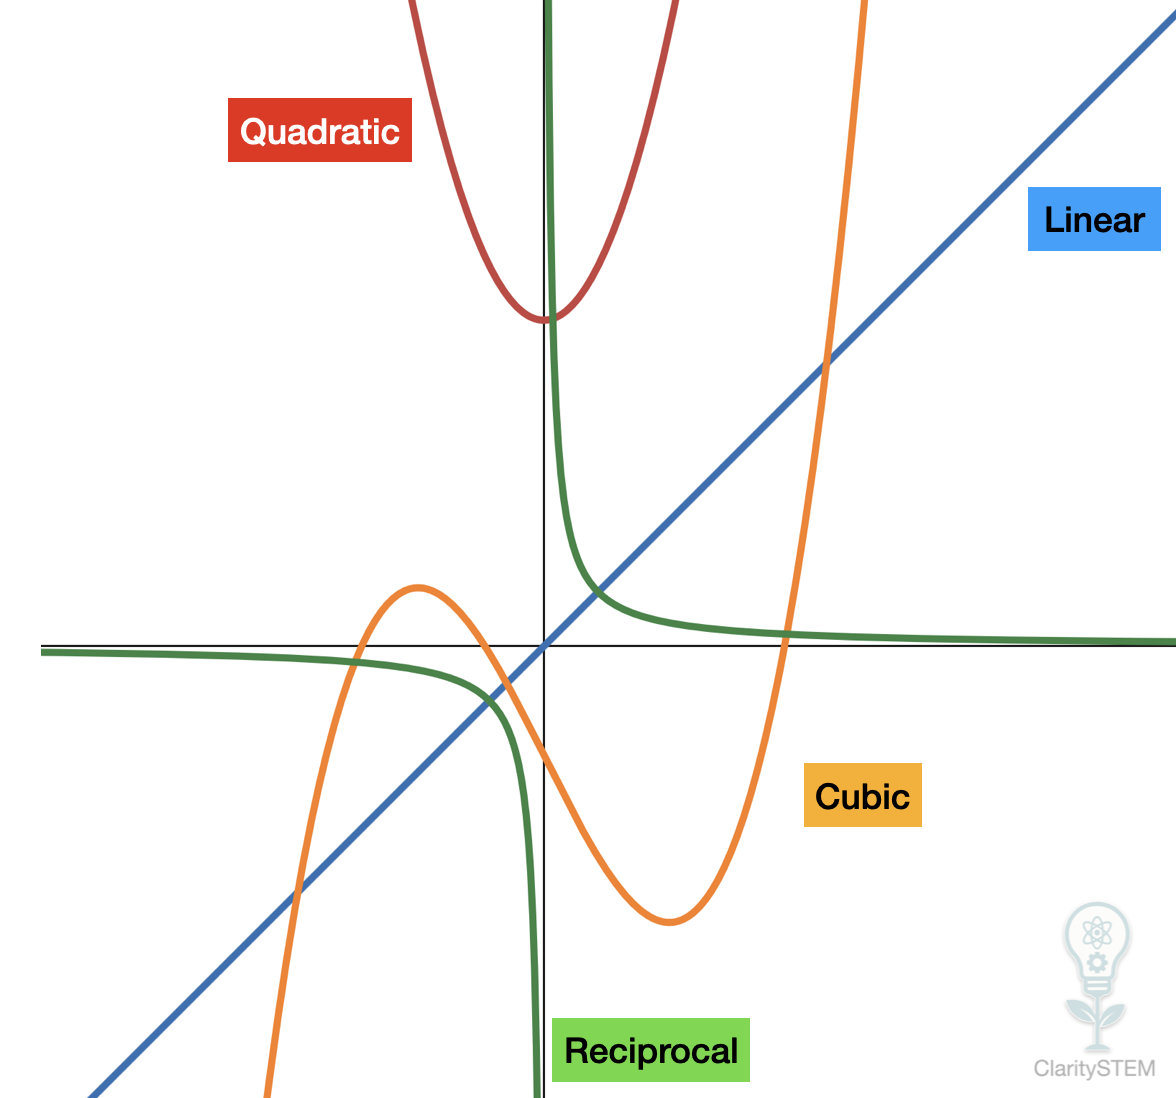
This topic focuses on recognising, sketching and interpreting several common non linear graphs. Each type has a characteristic shape that can be identified from its equation.
Quadratic Graphs of the Form y = ax² + b
Equations of this form produce quadratic graphs, which are curved and called parabolas.
The equation is written as
\( y = ax^2 + b \)
The value of a controls the direction of the curve.
a is positive so the graph opens upwards
a is negative so the graph opens downwards
The value of b gives the y intercept.
The turning point of the graph is always on the y axis at
\( (0, b) \)
Example
$$
y = 2x^2 - 3
$$
This graph opens upwards and crosses the y axis at \( -3 \).
Quadratic Graphs of the Form y = (ax + b)(cx + d)
This form also produces a quadratic graph, but it is written in factorised form.
The equation is written as
\( y = (ax + b)(cx + d) \)
The x intercepts can be found by setting each bracket equal to zero.
Example
$$
y = (x - 2)(x + 1)
$$
The graph crosses the x axis at
$$
x = 2
$$
and
$$
x = -1
$$
These intercepts help you sketch the curve accurately. The graph is still a smooth parabola.
Reciprocal Graphs of the Form y = a/x
Equations of this form produce reciprocal graphs.
The equation is written as
\( y = \frac{a}{x} \)
These graphs have two separate curves and never touch the axes.
The x axis and y axis act as asymptotes
a is positive so the graph lies in quadrants 1 and 3
a is negative so the graph lies in quadrants 2 and 4
Example
$$
y = \frac{3}{x}
$$
As \( x \) increases, \( y \) decreases but never reaches zero.
Cubic Graphs of the Form y = ax³
Equations of this form produce cubic graphs.
The equation is written as
\( y = ax^3 \)
These graphs pass through the origin and have a smooth S shape.
a is positive so the graph rises from bottom left to top right
a is negative so the graph falls from top left to bottom right
Example
$$
y = x^3
$$
Cubic graphs have rotational symmetry about the origin.
Key Points to Remember
Quadratic graphs are smooth curves called parabolas.
The sign of a controls whether quadratic and cubic graphs open upwards or downwards.
Factorised quadratics show x intercepts clearly from the brackets.
Reciprocal graphs never touch the axes and have asymptotes.
Cubic graphs pass through the origin and have an S shaped curve.
Recognising the form of an equation allows you to sketch and interpret non linear graphs accurately and efficiently.