Interpreting the Area Under a Graph
⭐ Higher Tier Content
This topic explains how to interpret the meaning of the area under a graph. In many situations, the area represents a real physical quantity, especially when graphs involve time.
Understanding Area Under a Graph
The area under a graph is the region between the graph and the horizontal axis over a given interval.
Unlike gradients, which represent rates of change, areas often represent total amounts.
What the area means depends entirely on what the axes represent.
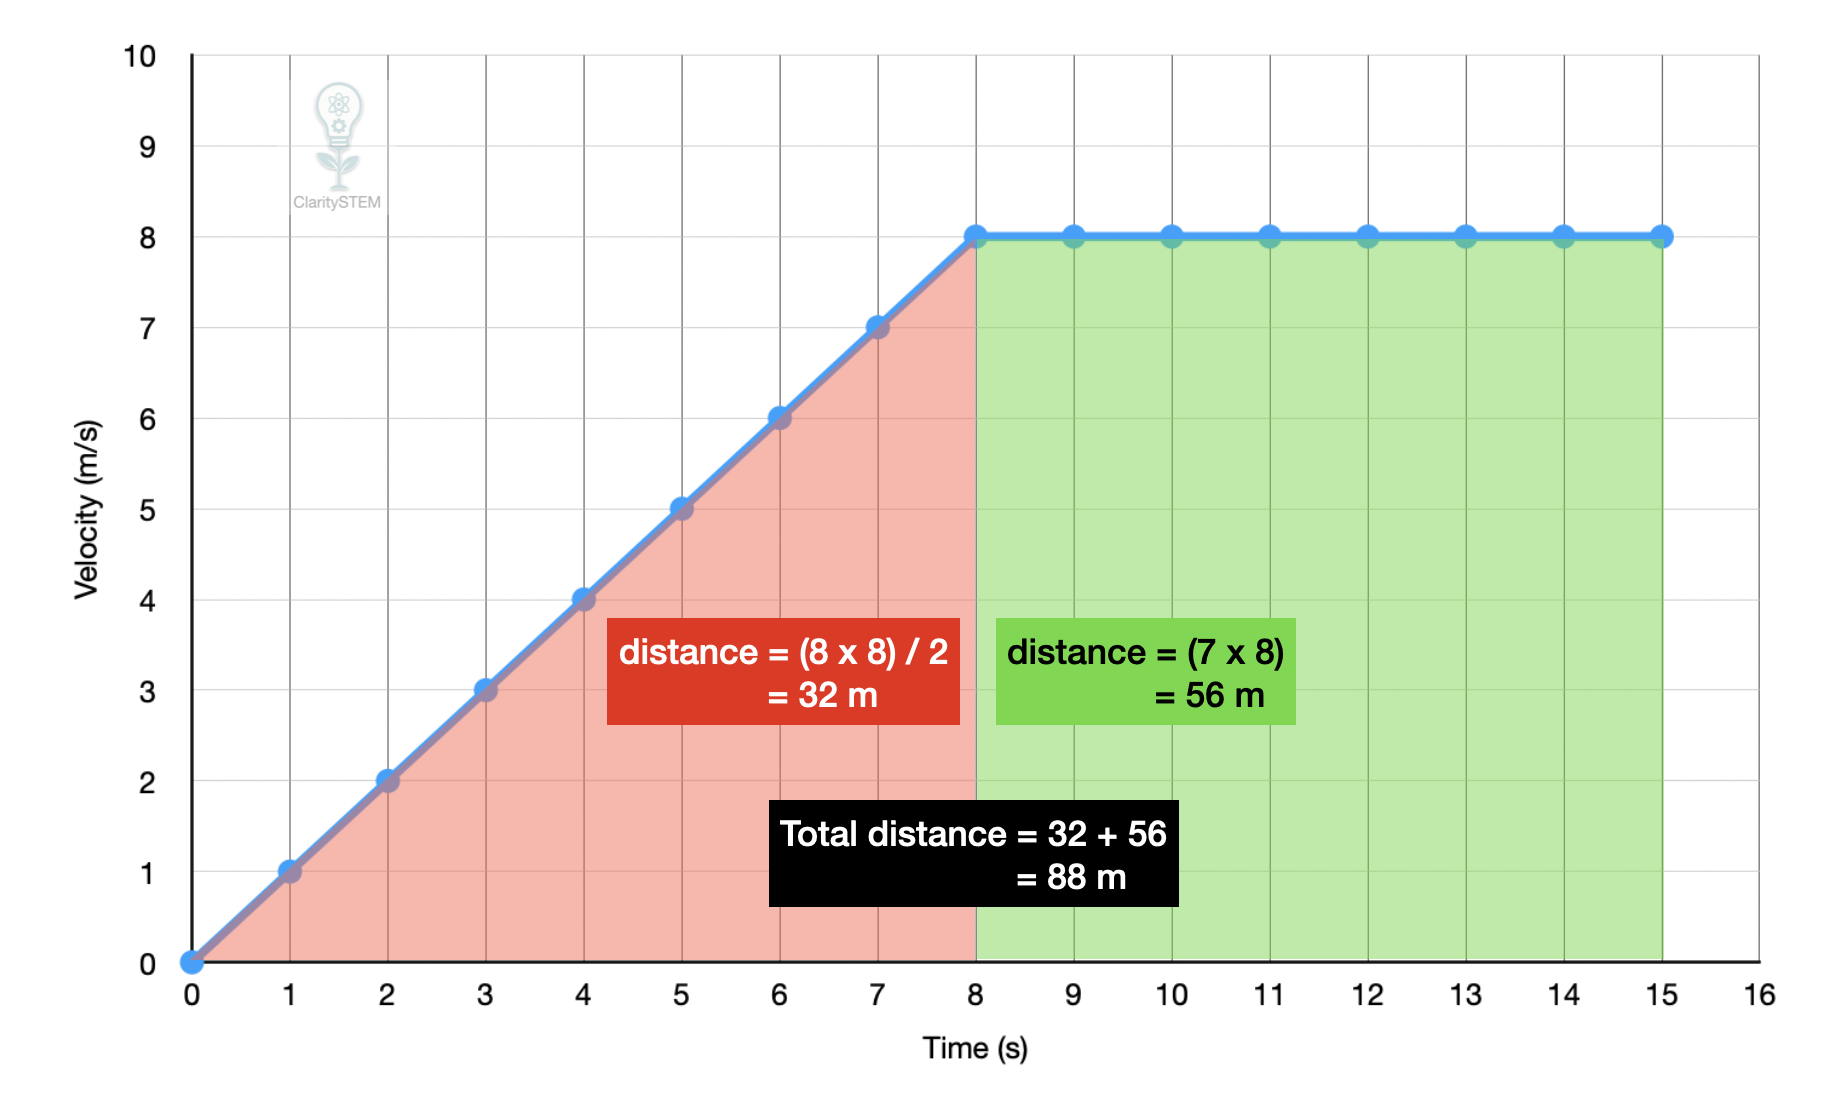
Area Under a Velocity Time Graph
On a velocity time graph:
• velocity is on the vertical axis
• time is on the horizontal axis
The area under the graph represents distance travelled.
This is because distance is found by multiplying velocity by time.
Example
$$
distance = velocity \times time
$$
If the graph is a straight line, the area can be found using shapes such as rectangles or triangles.
If the graph is curved, the area is estimated by splitting it into narrow strips or simple shapes.
The total area gives the total distance travelled
If part of the graph is below the time axis, this represents motion in the opposite direction.
Area Under Other Practical Graphs
The idea of area under a graph applies in many real life contexts.
For example:
• On a power time graph, the area represents energy used
• On a flow rate time graph, the area represents total volume
• On a current time graph, the area represents electric charge
In each case, the vertical axis shows a rate and the horizontal axis shows time.
The area combines these to give a total quantity.
Interpreting Units
Units are essential when interpreting areas.
To find the units of the area, multiply the units on the vertical axis by the units on the horizontal axis.
Example
If velocity is measured in metres per second and time in seconds, the area has units of metres.
This confirms that the area represents distance.
Always check the axis labels before interpreting the area.
Estimating Areas
If the graph is irregular or curved, the area is estimated rather than calculated exactly.
This can be done by:
• counting squares
• using trapezia
• approximating with rectangles
The estimate improves when smaller intervals are used.
Key Points to Remember
The area under a graph represents a total quantity.
On velocity time graphs, the area represents distance travelled.
The meaning of the area depends on the graph context.
Units of area come from multiplying the axis units.
Areas under curved graphs are usually estimated.
Interpreting the area under a graph allows you to connect graphical information to real physical quantities in practical situations.