Using, Interpreting and Producing Venn Diagrams
A Venn diagram is used to show relationships between sets of items. It helps to organise information clearly and is often used to solve problems involving groups, overlaps and totals.
A Venn diagram is usually drawn inside a rectangle. The rectangle represents the universal set, which contains all the items being considered. Circles inside the rectangle represent individual sets. Where circles overlap, the overlapping region represents items that belong to both sets.
To interpret a Venn diagram, read each region carefully. The number or items written in a region belong only to that region. Items in the overlap belong to both sets.
For example, if set A represents students who study Maths and set B represents students who study Science, the overlap shows students who study both subjects. The total number of students is found by adding all values inside the rectangle.
Mathematical notation is often used with Venn diagrams. The symbol \( \cup \) means union, which includes everything in either set. The symbol \( \cap \) means intersection, which includes only items common to both sets.
To produce a Venn diagram, start by placing information that belongs to both sets in the overlapping region. Then place information that belongs to only one set in the non overlapping parts of the circles. Always check that each item is placed once only.
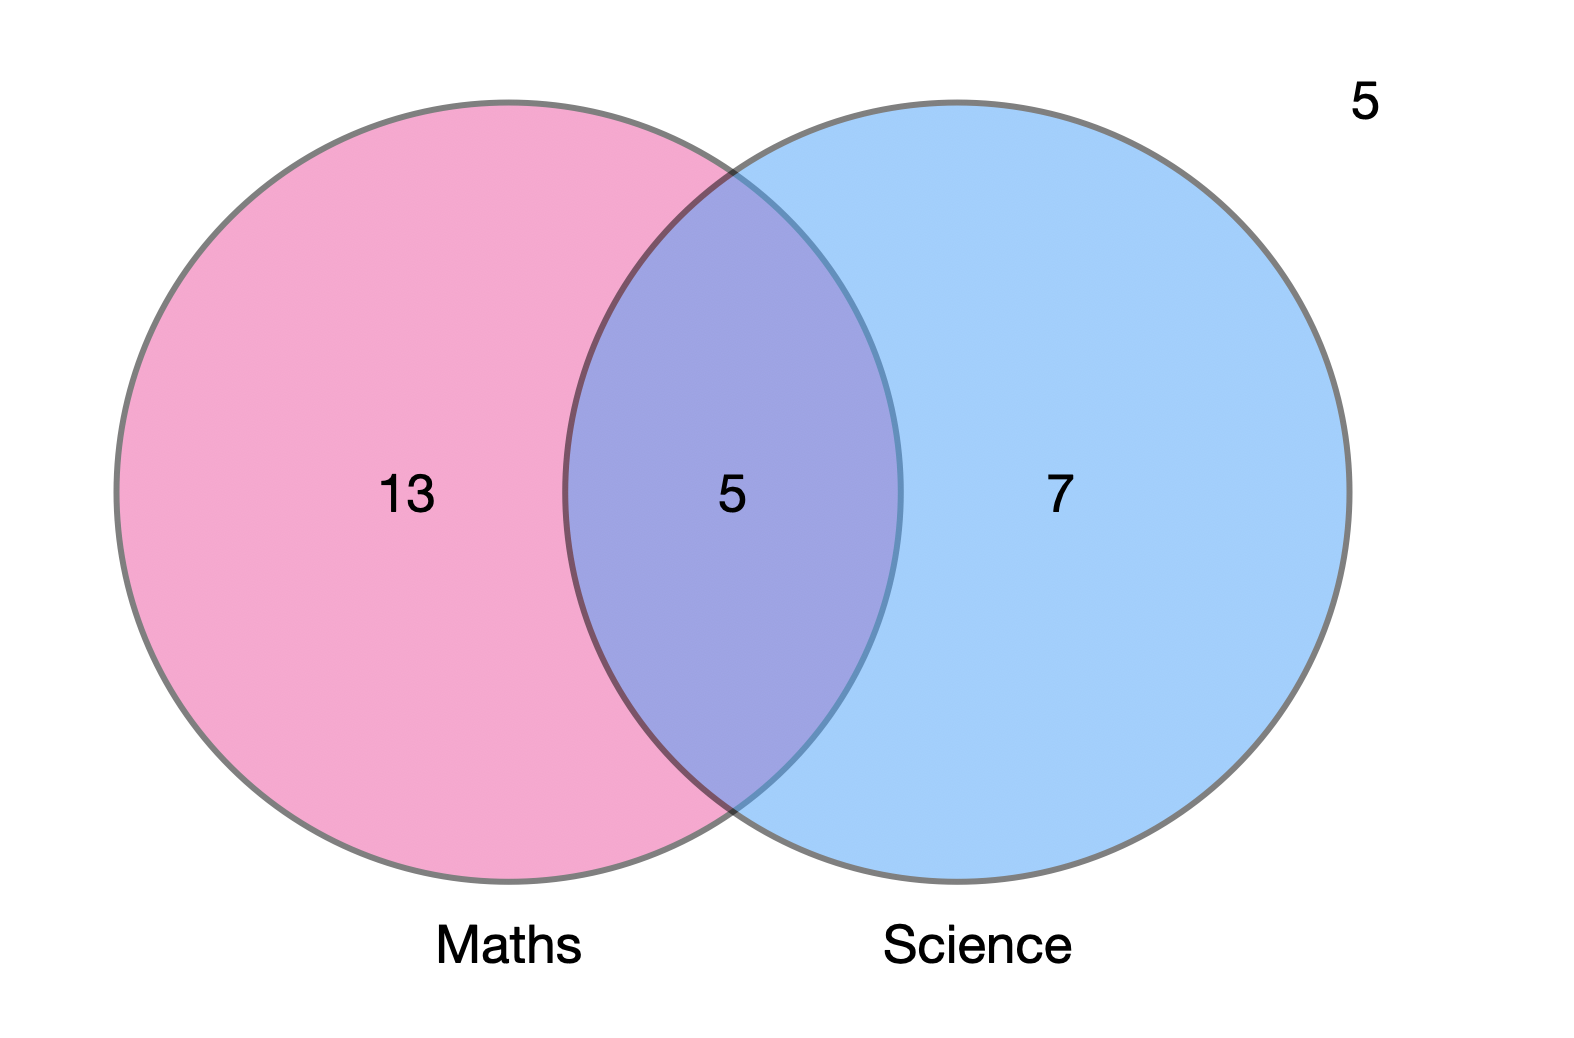
Consider this example. There are \( 30 \) students in total. \( 18 \) study Maths, \( 12 \) study Science and \( 5 \) study both.
The number who study only Maths is found by subtracting the overlap:
$$
18 - 5 = 13
$$
The number who study only Science is:
$$
12 - 5 = 7
$$
The number who study neither subject is found by subtracting everything inside the circles from the total:
$$
30 - (13 + 5 + 7) = 5
$$
A correctly drawn Venn diagram makes problems like this clearer and reduces mistakes. Always label sets clearly and check that the total matches the number in the universal set.