Tallying Methods
Tallying is a method used to collect and organise data as it is gathered. It is especially useful when counting how often different values or categories occur.
What a Tally Is
A tally is a quick counting mark used to record data.
Each time a value appears, a mark is added to the tally for that category.
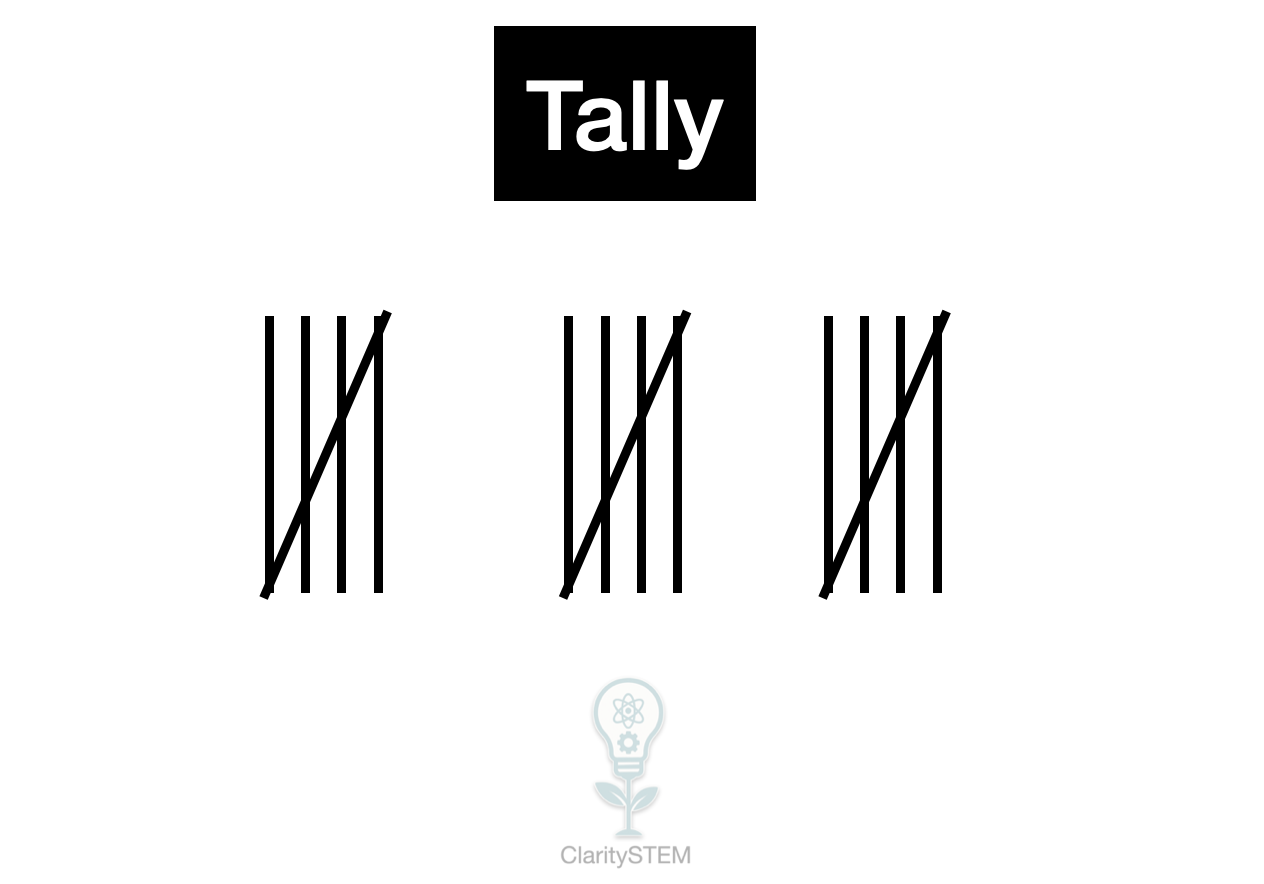
Tallies are usually grouped in fives to make counting easier.
Four vertical lines are drawn, and the fifth line crosses them.
This helps prevent counting errors when totals become large.
Why Tallying Is Useful
Tallying is useful because it:
• allows data to be recorded quickly
• reduces the chance of forgetting counts
• makes frequencies easy to find
• helps organise raw data clearly
Tallying is often used before drawing tables, charts or graphs.
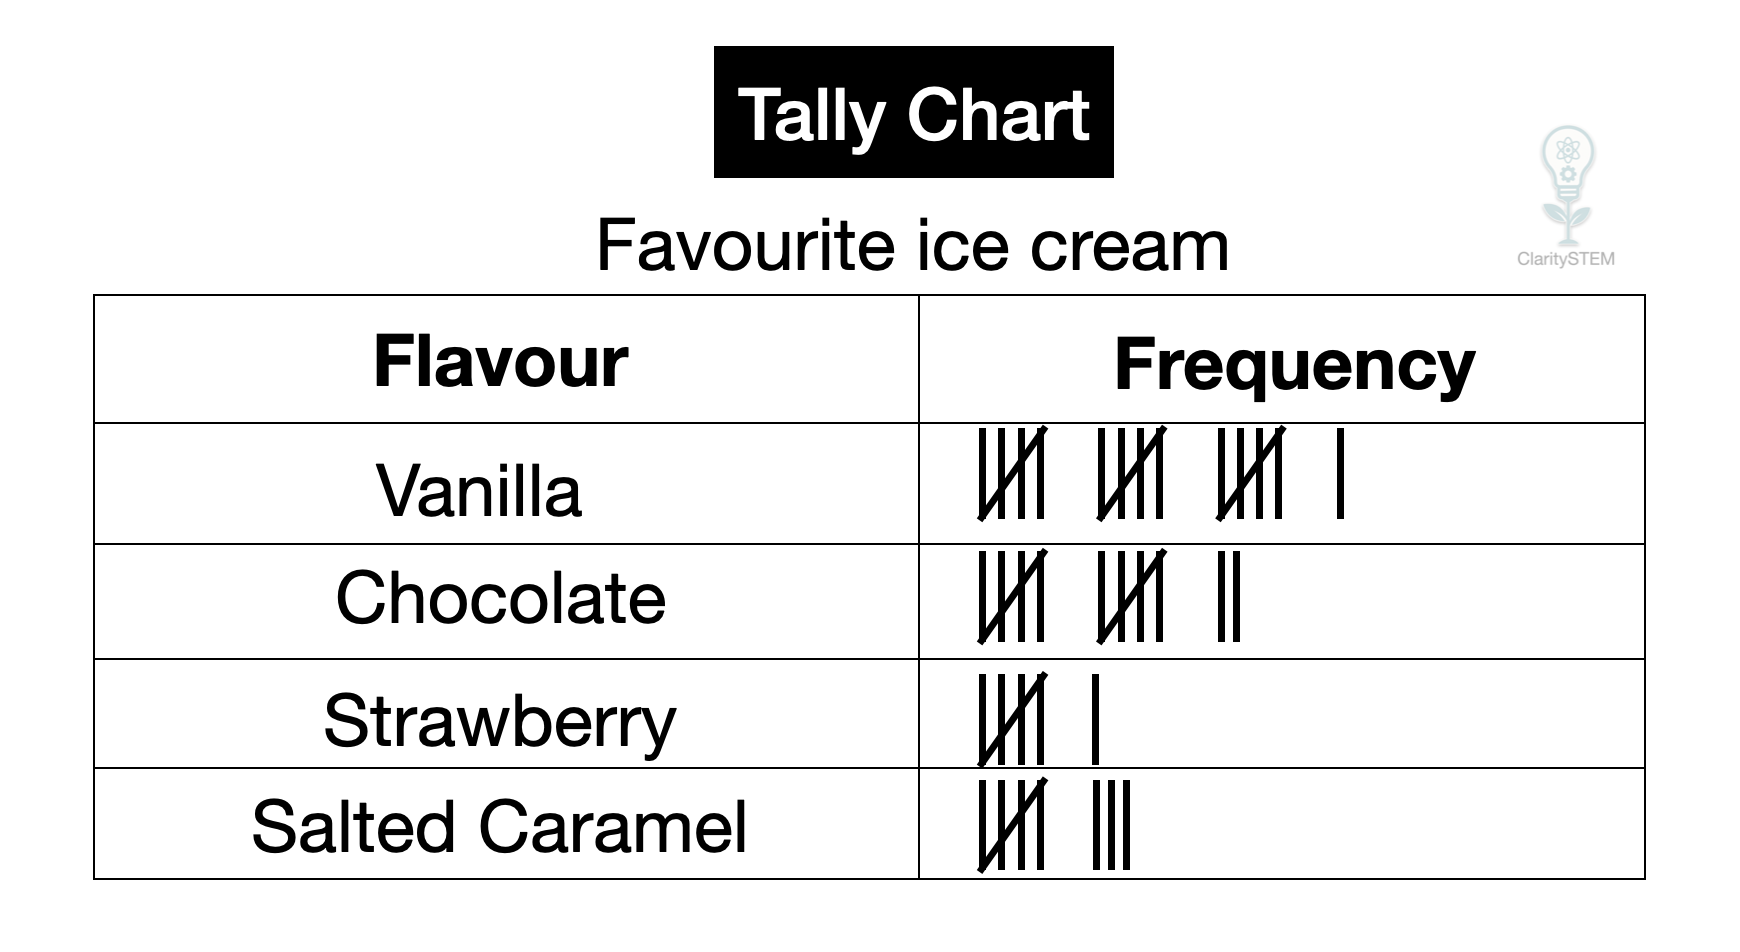
How to Use a Tally Chart
A tally chart has two main parts:
• a list of categories or values
• a tally column to record counts
As each data value is observed:
• find the correct category
• add one tally mark
• group tallies in fives
Once all data has been collected, the tallies are counted to find the frequency for each category.
Tallying Numerical Data
When tallying numerical data:
• decide on the values or groups before starting
• ensure every value fits into one category only
For example, test scores or shoe sizes can be tallied by listing each possible value or by grouping values into intervals.
Clear categories make tallying more accurate.
Tallying Categorical Data
Categorical data is data grouped by type rather than number.
Examples include colours, choices or types.
Each category has its own tally, and every response adds one mark to the correct category.
Each data value must be counted once and only once
Common Errors to Avoid
Common mistakes include:
• forgetting to group tallies in fives
• adding tallies to the wrong category
• changing categories while tallying
• miscounting grouped tallies
Careful checking helps avoid these errors.
Key Points to Remember
Tallying is used to count how often values occur.
Tallies are grouped in fives for easy counting.
Tally charts organise data clearly as it is collected.
Tallies are converted into frequencies at the end.
Accurate categories are essential for reliable results.
Understanding and using tallying methods helps ensure data is collected accurately and provides a strong foundation for further statistical analysis.