Drawing and Interpreting Implicitly Defined Graphs
⭐ Higher Tier Content
In this topic, graphs are drawn and interpreted when y is given implicitly in terms of x. This means y is not written on its own, but appears together with x in the same equation.
What an Implicit Equation Is
An equation is implicit if y is not the subject.
For example, y may appear squared or multiplied by x, or mixed with x terms on the same side of the equation.
An implicit equation does not immediately show the shape of the graph, so it must be rearranged or analysed carefully.
Example of an implicit equation
\( x^2 + y^2 = 25 \)
Here, y is not written as a function of x.
Drawing an Implicit Graph
To draw a graph from an implicit equation, there are two common approaches.
One approach is to rearrange the equation to make y the subject, if possible.
Another approach is to substitute values of x and calculate the corresponding values of y.
Example
$$
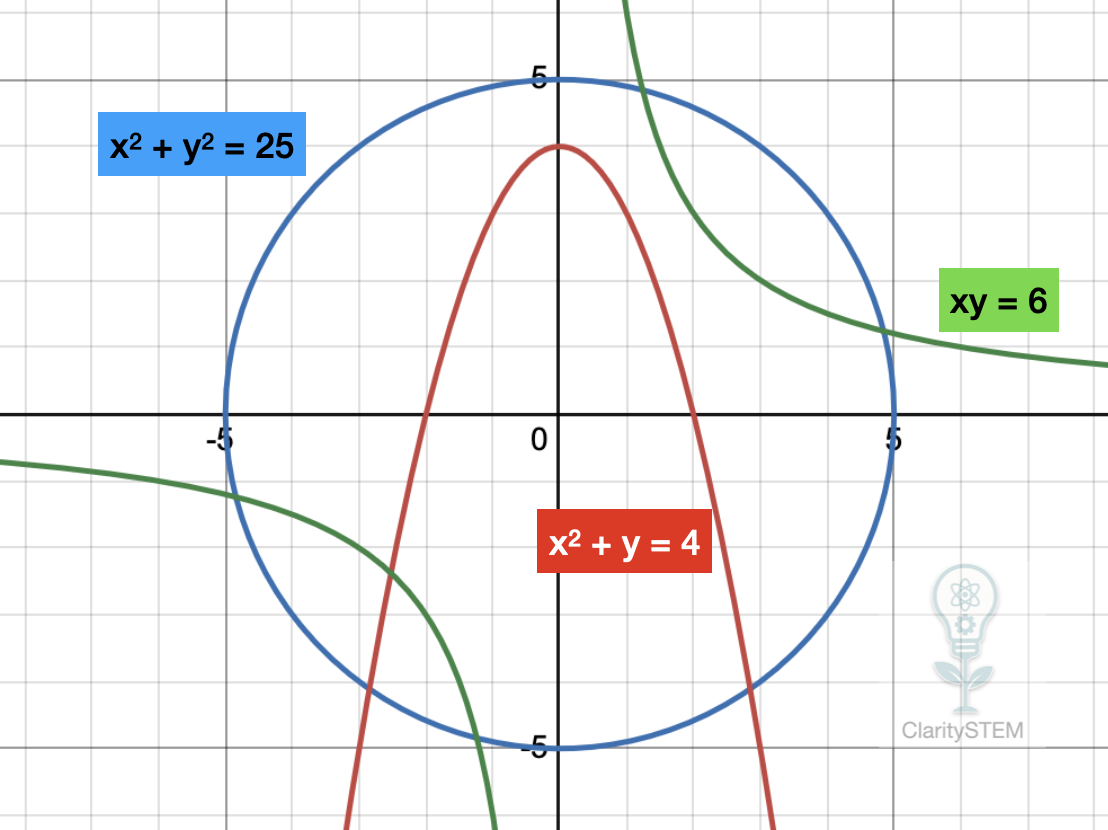
x^2 + y^2 = 25
$$
Rearrange to make y the subject:
$$
y^2 = 25 - x^2
$$
Then take the square root:
$$
y = \sqrt{25 - x^2}
$$
and
$$
y = -\sqrt{25 - x^2}
$$
This shows that the graph has two parts, one above and one below the x axis.
The graph is a circle with centre at the origin and radius 5.
Interpreting Implicit Graphs
When interpreting an implicit graph, look at its key features.
Check for symmetry by replacing x with -x or y with -y.
Find where the graph crosses the axes by setting x or y equal to zero.
Identify whether the graph has more than one y value for a given x value.
Implicit graphs can fail the vertical line test, meaning one x value may correspond to two y values.
Example
$$
x^2 + y = 4
$$
Rearrange:
$$
y = 4 - x^2
$$
This is a quadratic graph that opens downwards and crosses the y axis at 4.
More Complex Implicit Equations
Some implicit equations cannot be rearranged easily.
In these cases, plotting points is often the best method.
Example
$$
xy = 6
$$
Rearrange:
$$
y = \frac{6}{x}
$$
This produces a reciprocal graph with two separate branches.
The graph never touches the x axis or y axis
Understanding how the equation restricts possible values of x and y helps you sketch the graph accurately.
Key Points to Remember
Implicit equations do not have y written as the subject.
Rearranging can reveal the shape of the graph.
Some implicit graphs have two y values for one x value.
Symmetry and intercepts help with interpretation.
Plotting points is useful when rearranging is difficult.
Drawing and interpreting implicit graphs requires careful algebra and attention to how x and y are linked within the equation.