Histograms with Unequal Class Widths
⭐ Higher Tier Content
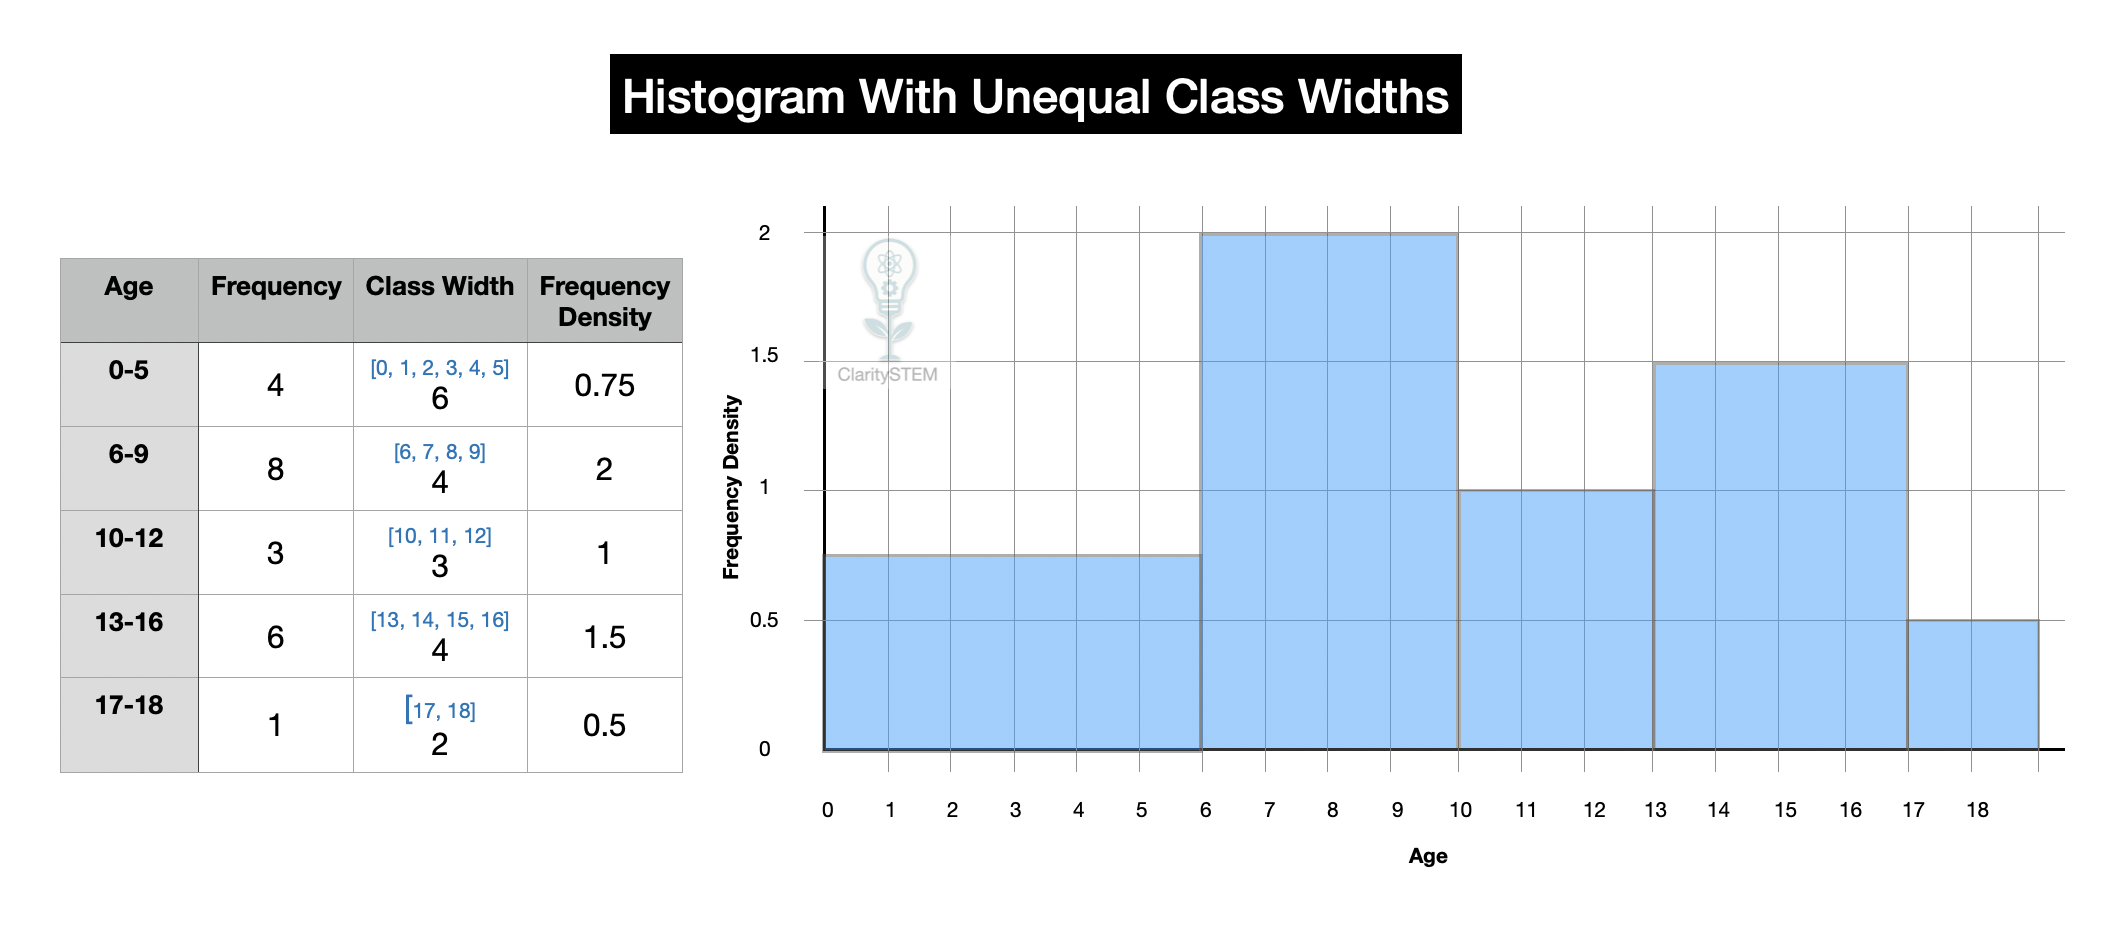
A histogram is used to represent grouped continuous data. When class widths are unequal, the heights of the bars must be adjusted so that the area of each bar represents frequency. Histograms can also be used to estimate the median and other percentages of the distribution.
Understanding Unequal Class Widths
In grouped data, class intervals may not all be the same size.
When class widths are unequal:
• bar widths vary
• bar heights must be adjusted
• frequency is no longer shown directly by height
Instead, the area of each bar shows the frequency.
This ensures a fair visual comparison between classes.
Why Frequency Density Is Used
With unequal class widths, frequency density is used to determine bar height.
Frequency density compares frequency with class width so that:
• wider classes do not appear more frequent just because they are wider
• narrower classes are not visually underrepresented
The vertical axis of a histogram with unequal class widths is labelled frequency density, not frequency.
Constructing the histogram correctly is essential
Constructing a Histogram with Unequal Class Widths
To construct a histogram:
• draw and label both axes
• place class intervals on the horizontal axis using correct widths
• label the vertical axis as frequency density
• calculate frequency density for each class
• draw bars with heights based on frequency density
• ensure bars touch, as the data is continuous
Each bar’s area must be proportional to the frequency in that class.
Interpreting a Histogram
When interpreting a histogram, you can:
• identify where data values are concentrated
• describe the shape of the distribution
• compare different class intervals
• identify skewness
Tall bars with narrow widths may represent fewer values than wider bars with lower height, so area must be considered, not just height.
Estimating the Median from a Histogram
The median is the value where half the data lies below it.
To estimate the median using a histogram:
• find the total frequency
• work out half of this total
• use the bars to find where this position lies
• identify the class interval containing the median
• estimate the median value within that class
This estimation assumes values are evenly spread within the class.
The median found is an estimate
Estimating Other Percentages
Histograms can also be used to estimate other percentages, such as quartiles or percentiles.
To do this:
• calculate the required percentage of the total frequency
• locate where this position falls within the histogram
• estimate the corresponding value
As with the median, these are estimates due to grouping.
Limitations of Histograms
Histograms:
• do not show exact individual values
• require careful construction with unequal class widths
• give estimates rather than exact values
Wide class intervals reduce accuracy.
Common Errors to Avoid
Common mistakes include:
• using frequency instead of frequency density
• drawing bars with incorrect widths
• comparing heights instead of areas
• treating estimates as exact values
Attention to scale and labelling prevents these errors.
Key Points to Remember
Histograms represent grouped continuous data.
Unequal class widths require frequency density.
Bar area represents frequency.
Medians and percentages can be estimated from histograms.
All values obtained are estimates, not exact.
Being able to construct and interpret histograms with unequal class widths allows grouped data to be represented fairly and supports accurate estimation of medians and percentages in statistical analysis.