Identifying Outcomes of Combined Experiments
When two or more experiments are combined, all possible outcomes must be identified clearly. This complete set of outcomes is called the sample space. There are several standard ways to represent sample spaces, each suited to different situations.
Understanding Combined Experiments
A combined experiment involves more than one action, such as:
• tossing two coins
• rolling a die and flipping a coin
• choosing two objects in sequence
Each outcome must describe what happens in every part of the experiment.
An outcome must be complete, not partial
Lists of Outcomes
A list is the simplest way to show all outcomes.
Each outcome is written explicitly.
For example, when tossing two coins, each outcome records the result of the first and second toss.
Lists are useful when:
• the number of outcomes is small
• outcomes are easy to write
If the number of outcomes is large, lists can become impractical.
Sample Space Diagrams
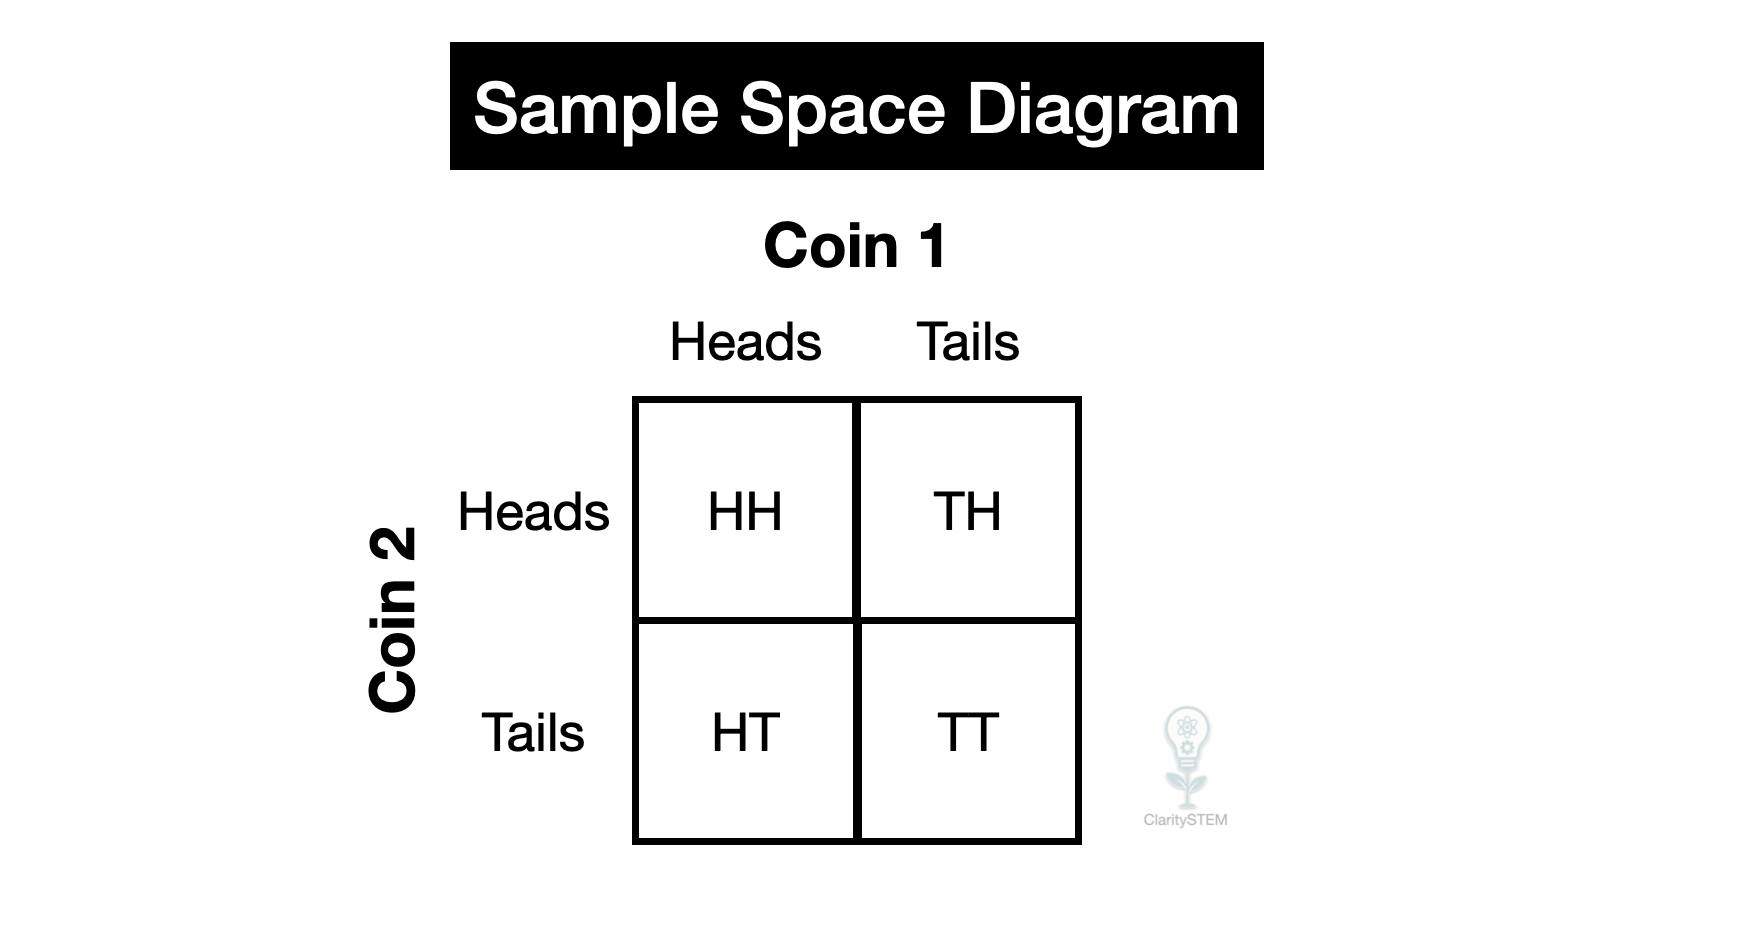
A sample space diagram is a table that shows all combinations of outcomes.
One experiment is represented along one direction and the second experiment along the other.
Each cell shows one possible outcome.
Sample space diagrams:
• help ensure no outcomes are missed
• make patterns easier to see
They are especially useful for two stage experiments with a small number of outcomes.
Tree Diagrams
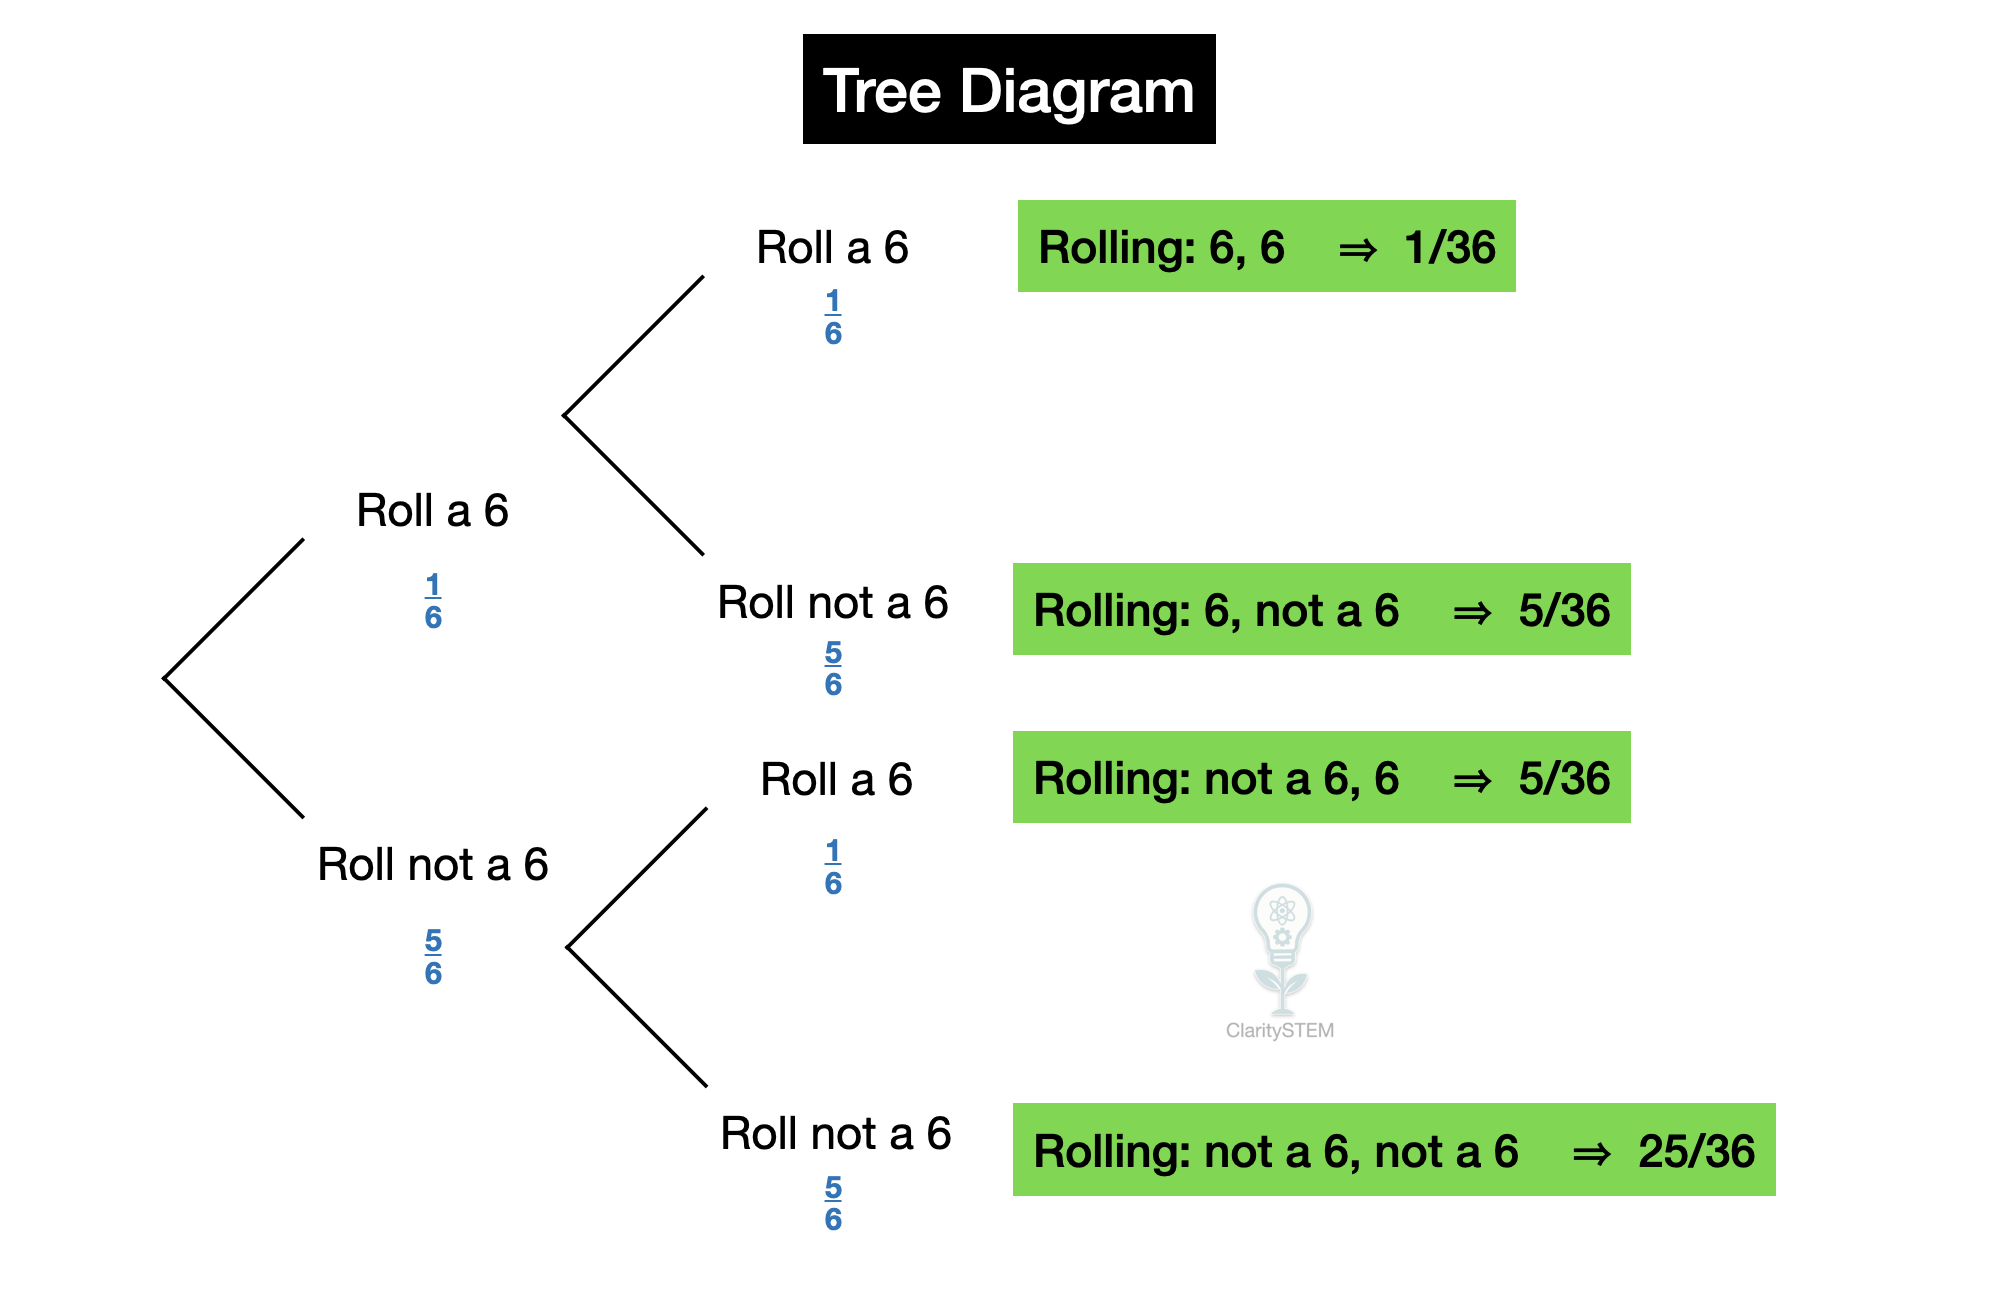
A tree diagram shows outcomes step by step.
Each branch represents a possible result of part of the experiment.
The branches spread out to show all combinations.
Tree diagrams are useful when:
• experiments happen in sequence
• probabilities change between stages
• outcomes are conditional
Each complete path from start to finish represents one outcome.
Always follow branches to the end to identify outcomes
Venn Diagrams
A Venn diagram shows outcomes using overlapping regions.
They are used when:
• outcomes belong to different sets
• events may overlap
• relationships between events are important
Each region represents a different outcome or group of outcomes.
Venn diagrams are especially useful when working with events such as A and B and their overlaps.
Choosing the Right Representation
Different methods suit different situations.
Lists are best for very small sample spaces.
Sample space diagrams are best for two simple experiments.
Tree diagrams are best for sequential experiments.
Venn diagrams are best for overlapping events.
The key aim is always the same: to show all possible outcomes clearly.
Common Errors to Avoid
Common mistakes include:
• missing outcomes
• repeating the same outcome
• listing incomplete outcomes
• using the wrong diagram for the situation
Careful organisation prevents these errors.
Key Points to Remember
A sample space contains all possible outcomes.
Combined experiments require complete outcomes.
Lists, sample space diagrams, tree diagrams and Venn diagrams can all be used.
Each method helps organise outcomes clearly.
No outcome should be missing or counted twice.
Being able to identify all outcomes of combined experiments ensures probability calculations are accurate and logically sound.