Frequency Tables
A frequency table is used to organise data by showing how often each value or category occurs. Frequency tables make raw data easier to read, analyse and represent.
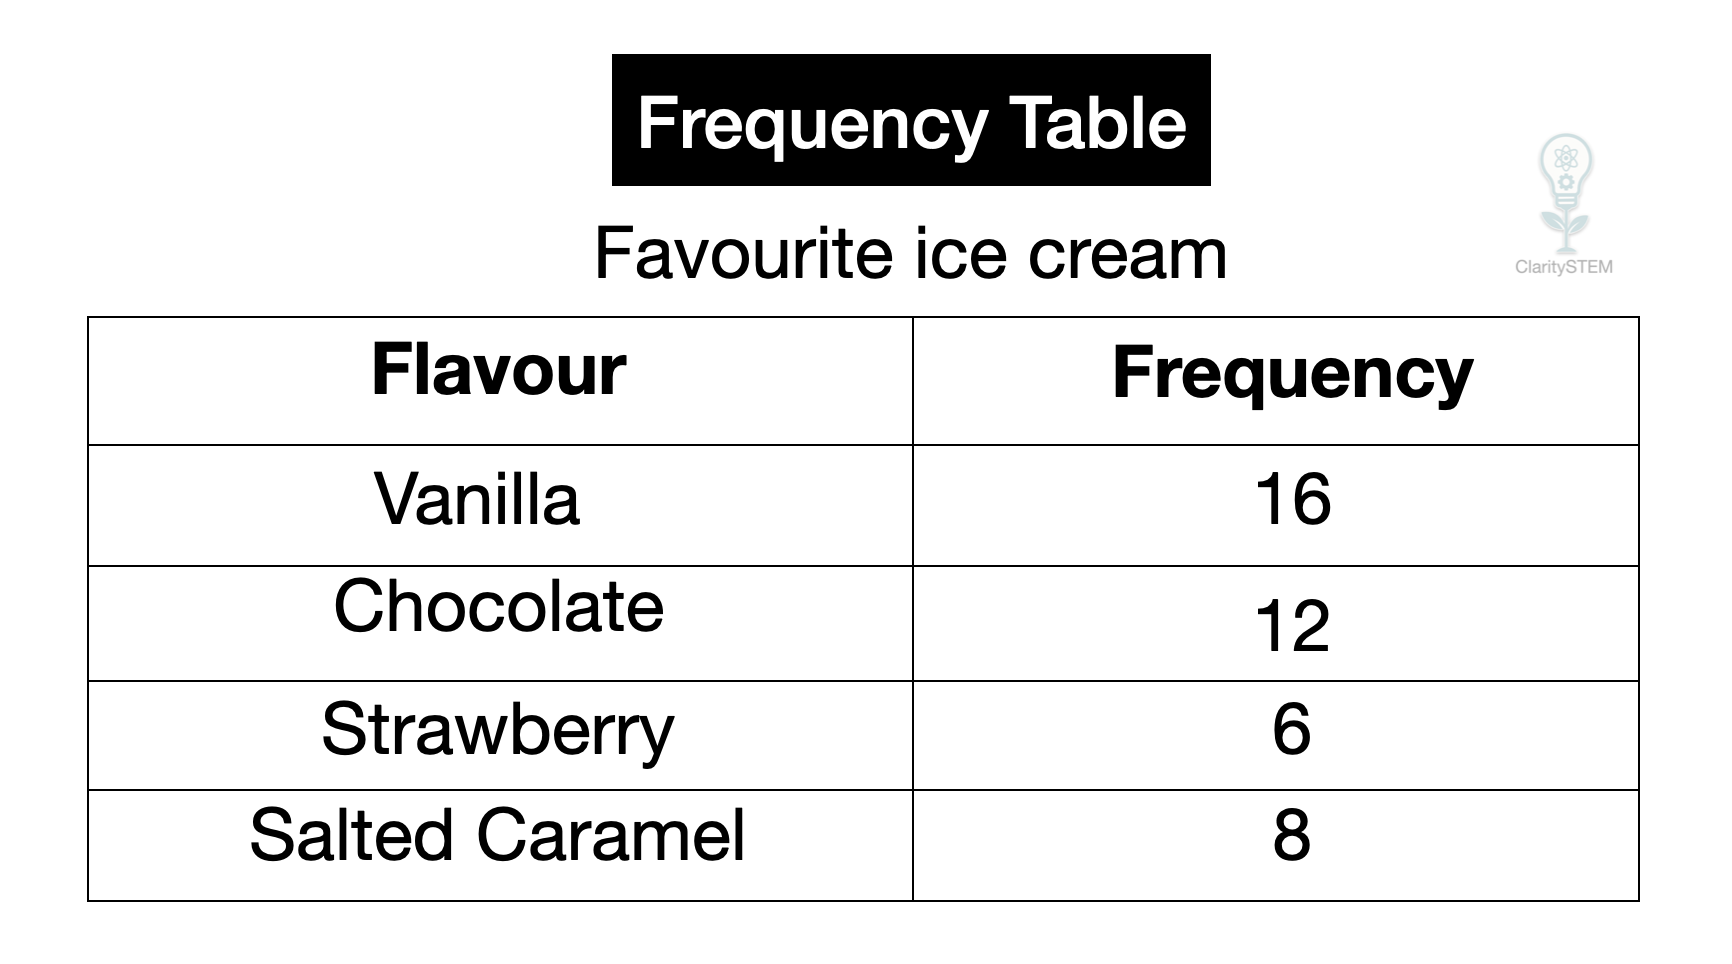
What a Frequency Table Is
A frequency table lists:
• the different data values or categories
• the frequency, which is the number of times each value occurs
Each data value is counted once and placed into the correct row of the table.
Frequency tables can be used for:
• numerical data
• categorical data
Why Frequency Tables Are Useful
Frequency tables:
• organise large amounts of data clearly
• make patterns easier to see
• help identify the most and least common values
• provide a starting point for drawing graphs
They are often created after tallying data.
Using a Frequency Table
To use a frequency table:
• list all possible values or categories
• count how many times each occurs
• record the totals in the frequency column
The total of all frequencies should equal the total number of data values collected.
Check totals to avoid counting errors
Frequency Tables for Discrete Data
Discrete data takes specific values, usually whole numbers.
Examples include:
• number of siblings
• test scores out of 10
• shoe sizes
Each possible value has its own row in the frequency table.
Frequency Tables for Grouped Data
Sometimes data is grouped into class intervals.
This is useful when:
• there are many different values
• the data range is large
Each class interval represents a range of values, and the frequency shows how many data values fall into that range.
Intervals should:
• cover all data values
• not overlap
• be the same size where possible
Using Frequency Tables to Answer Questions
Frequency tables can be used to:
• find the most common value
• find the least common value
• calculate totals
• compare categories
They are also used to help draw bar charts, pie charts and frequency diagrams.
Common Errors to Avoid
Common mistakes include:
• missing out values or categories
• overlapping class intervals
• incorrect totals
• placing values in the wrong group
Careful organisation prevents these errors.
Key Points to Remember
Frequency tables show how often values occur.
Each value or category has a frequency.
The total frequency equals the number of data values.
Tables can be used for discrete or grouped data.
Frequency tables help with further data analysis.
Understanding and using frequency tables allows data to be organised clearly and analysed accurately in statistical problems.