Relative Frequency and Number of Trials
A relative frequency graph is used to show how the estimated probability of an event changes as the number of trials increases. It helps illustrate the idea that probability becomes more reliable over time.
What Relative Frequency Means
Relative frequency is the proportion of times an event occurs.
It is found by comparing:
• the number of times the event occurs
• the total number of trials
Relative frequency is an estimate of probability based on experimental evidence.
Because it is based on results, it can change as more trials are carried out.
Drawing a Relative Frequency Graph
A relative frequency graph shows how the estimate develops over time.
To draw the graph:
• put the number of trials on the horizontal axis
• put relative frequency on the vertical axis
• plot the relative frequency after a certain number of trials
• join the points smoothly
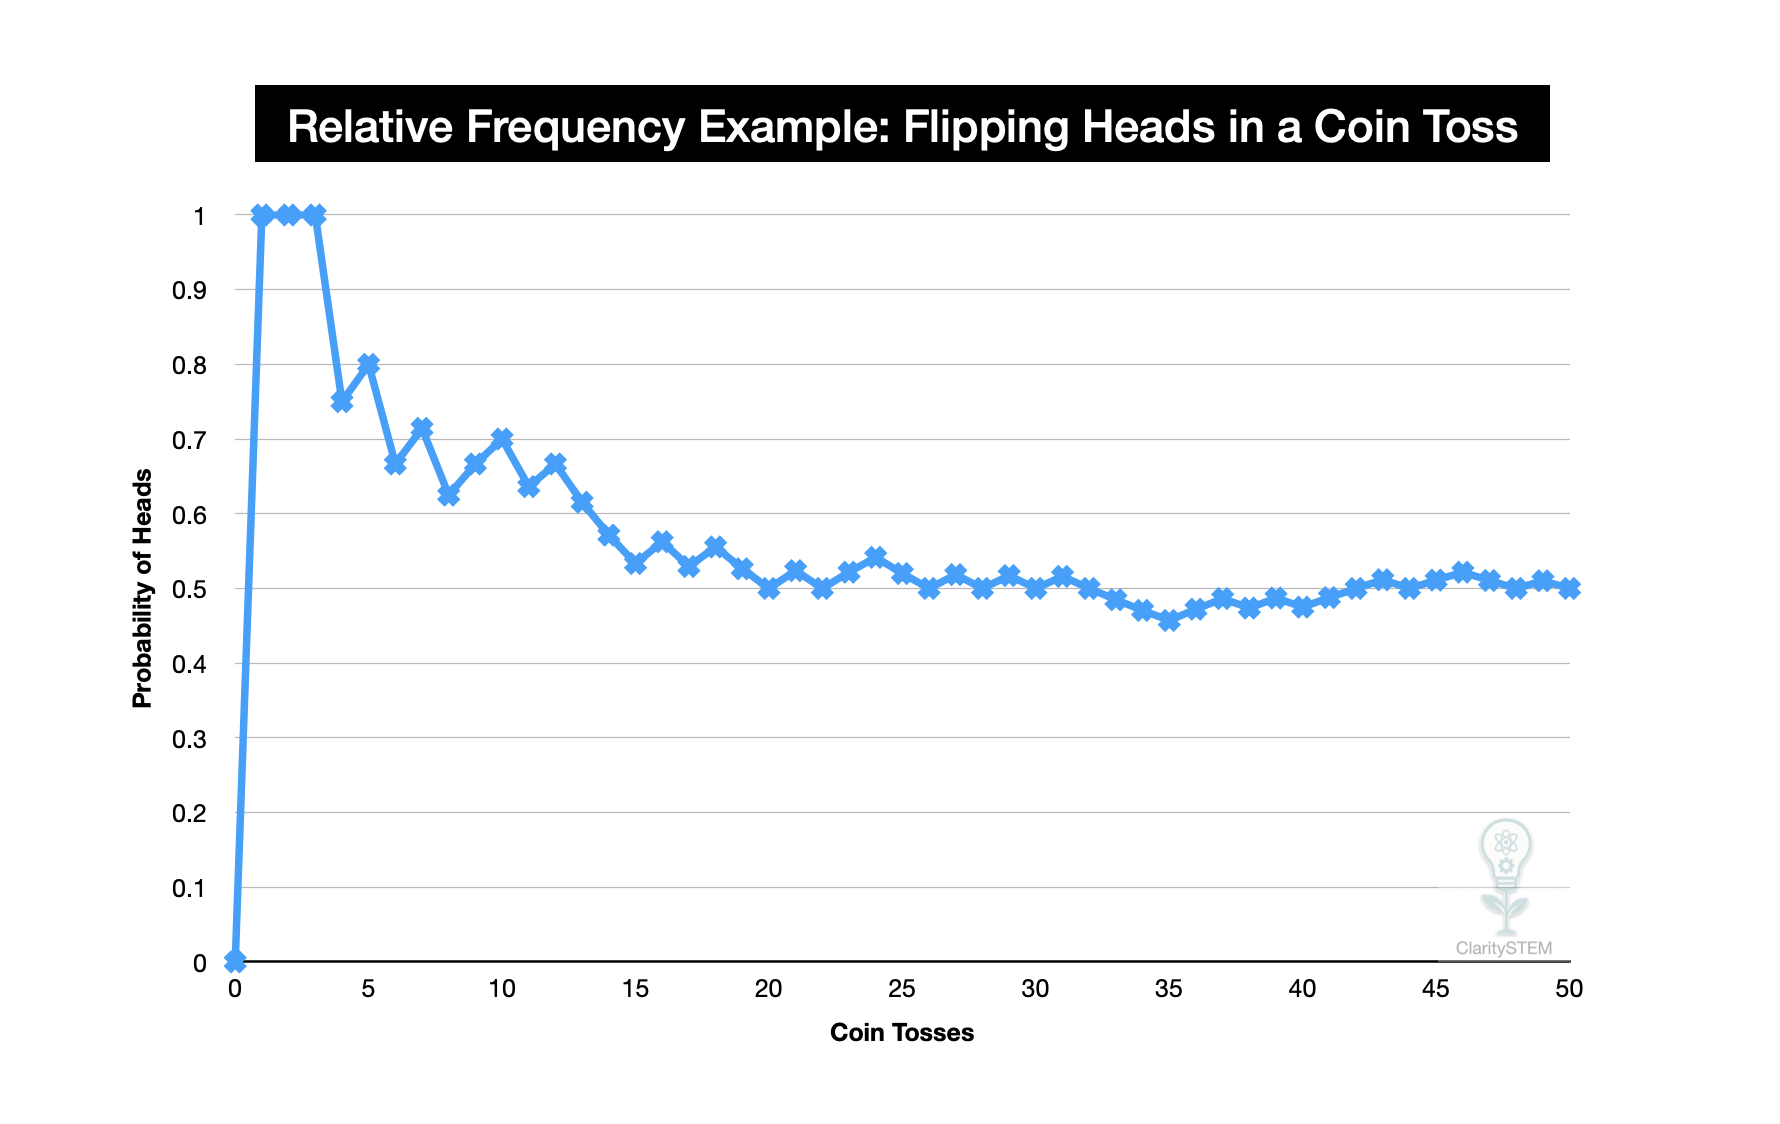
The graph usually starts with larger jumps when there are only a few trials.
As the number of trials increases, the graph tends to settle down.
The axes must be clearly labelled and to a sensible scale
Interpreting the Graph
When interpreting a relative frequency graph, look for:
• how much the relative frequency changes at the start
• whether the values begin to stabilise
• the value the graph appears to settle around
Early in the experiment, the relative frequency may fluctuate a lot.
Later, changes usually become smaller.
This shows that the estimate is becoming more reliable.
Long Term Stability of Relative Frequency
As the number of trials becomes large, the relative frequency is expected to stabilise.
This means:
• it fluctuates less
• it settles around a fixed value
• it becomes a better estimate of probability
This behaviour explains why probability is described as a long term measure.
Stability does not mean the graph becomes perfectly flat
Link to Probability
The value that the relative frequency settles around is taken as the true probability of the event.
The more trials carried out:
• the closer the relative frequency usually gets to this value
• the more confidence we have in the estimate
This links experimental probability to theoretical probability.
Common Errors to Avoid
Common mistakes include:
• expecting stability after only a few trials
• assuming the relative frequency will stop changing completely
• misreading scales on the axes
• confusing number of trials with frequency
Always consider the size of the sample.
Key Points to Remember
Relative frequency estimates probability from experiments.
Graphs plot relative frequency against number of trials.
Early results often fluctuate widely.
As trials increase, relative frequency is expected to stabilise.
Long term behaviour gives more reliable probability estimates.
Understanding relative frequency graphs helps explain why probability becomes more dependable as more evidence is collected.