Drawing and Interpreting Straight Line Graphs
Graphs are used to show the relationship between variables. Some of the most important straight line graphs at GCSE level are those of the form
\( x = a \), \( y = b \) and \( y = ax + b \).
Being able to draw, interpret, recognise and sketch these graphs is essential.
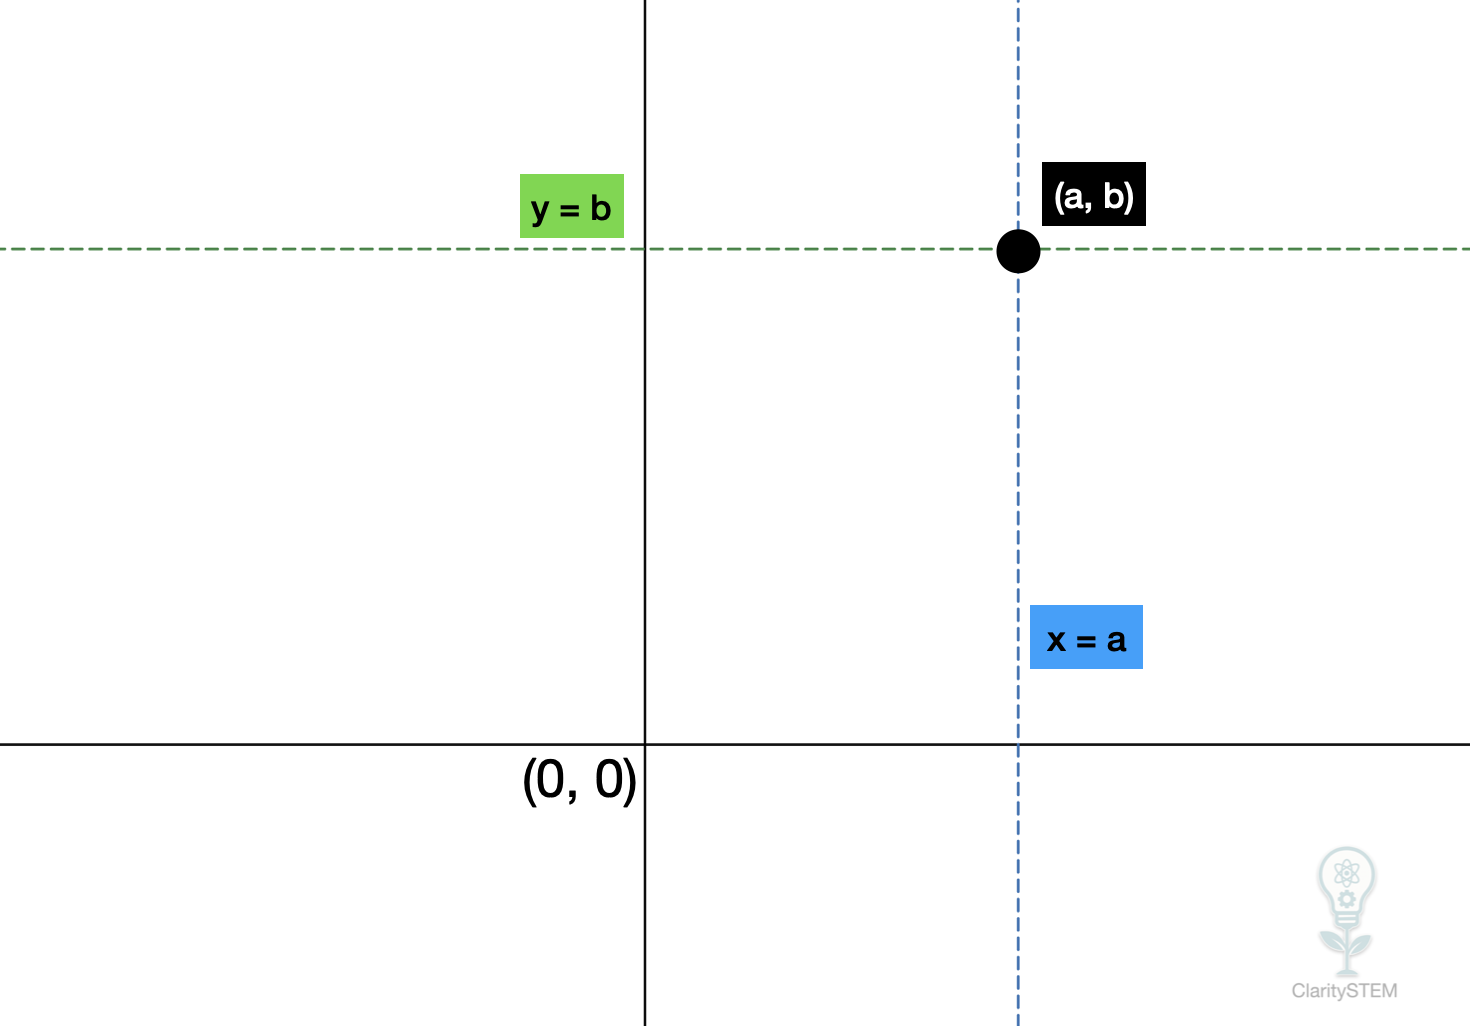
The Graph of x = a
The equation:
$$
x = a
$$
represents a vertical straight line.
• The value of \( x \) is fixed
• The value of \( y \) can be anything
For example:
$$
x = 3
$$
This is a vertical line that crosses the x axis at \( 3 \).
Every point on the line has an x coordinate of \( 3 \), such as:
$$
(3,\ 1),\ (3,\ -2),\ (3,\ 5)
$$
Key features:
• The line is parallel to the y axis
• It has no gradient
The Graph of y = b
The equation:
$$
y = b
$$
represents a horizontal straight line.
• The value of \( y \) is fixed
• The value of \( x \) can be anything
For example:
$$
y = -2
$$
This is a horizontal line that crosses the y axis at \( -2 \).
Every point on the line has a y coordinate of \( -2 \), such as:
$$
(1,\ -2),\ (-4,\ -2),\ (6,\ -2)
$$
Key features:
• The line is parallel to the x axis
• The gradient is zero
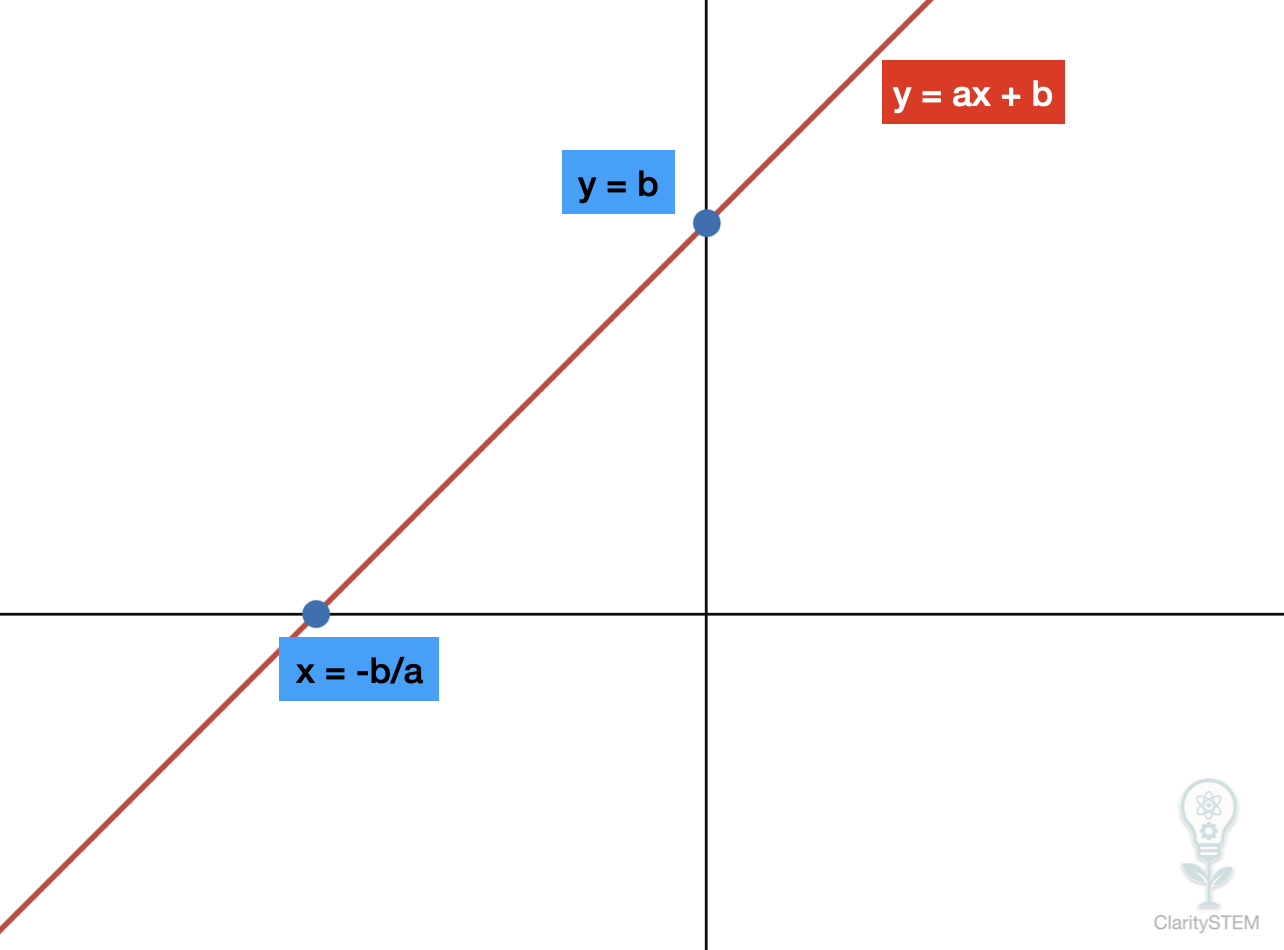
The Graph of y = ax + b
The equation:
$$
y = ax + b
$$
represents a straight line with a gradient.
• \( a \) is the gradient
• \( b \) is the y intercept
The y intercept is the point where the line crosses the y axis.
Understanding the Gradient a
The gradient \( a \) shows how steep the line is.
• If \( a \) is positive, the line slopes upwards from left to right
• If \( a \) is negative, the line slopes downwards from left to right
• A larger value of \( a \) gives a steeper line
For example:
$$
y = 2x + 1
$$
The gradient is \( 2 \), meaning the line goes up 2 units for every 1 unit moved to the right.
Understanding the Intercept b
The intercept \( b \) tells you where the line crosses the y axis.
For example:
$$
y = -x + 3
$$
The line crosses the y axis at:
$$
(0,\ 3)
$$
Sketching y = ax + b
To sketch a graph of the form \( y = ax + b \):
- Plot the y intercept \( (0,\ b) \)
- Use the gradient to find another point
- Draw a straight line through the points
For example, for:
$$
y = 3x - 2
$$
The y intercept is \( (0,\ -2) \).
Using the gradient of \( 3 \), another point is \( (1,\ 1) \).
Recognising Graphs from Equations
• \( x = a \) always gives a vertical line
• \( y = b \) always gives a horizontal line
• \( y = ax + b \) gives a sloping straight line
Recognising these forms quickly helps when interpreting graphs or sketching without full calculations.
Key Points to Remember
\( x = a \) gives a vertical line.
\( y = b \) gives a horizontal line.
\( y = ax + b \) gives a straight line with gradient \( a \) and intercept \( b \).
Straight line graphs extend infinitely in both directions.
Understanding these basic graphs is the foundation for all further work with linear graphs and coordinate geometry.